0
$\begingroup$

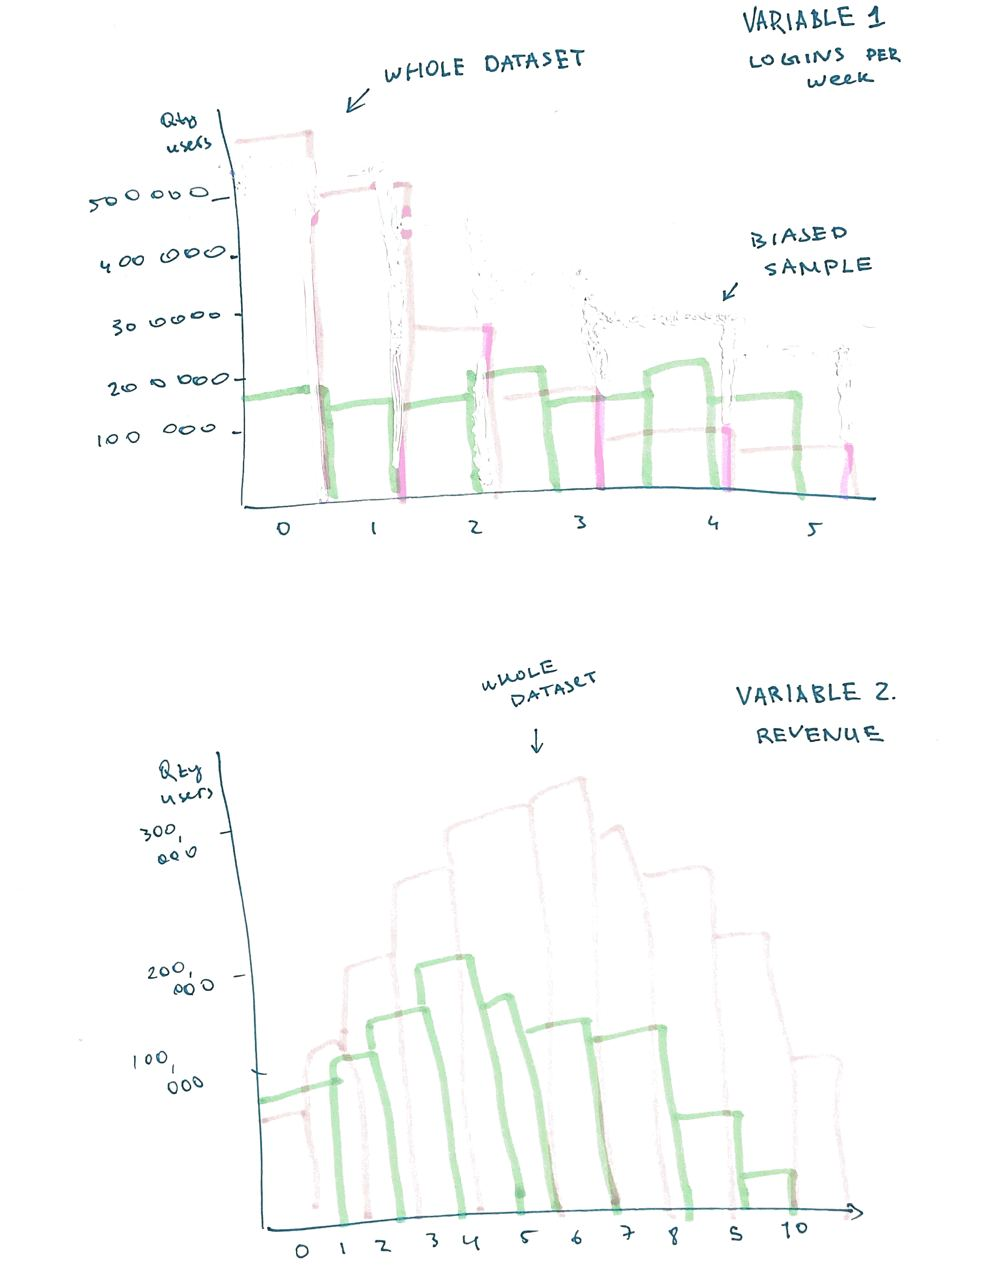
I have a biased sample from a user activity dataset with known distributions of two variables, the amount of times a user logged in during last week (Poisson distribution) and user's weekly revenue (this one looks normally distributed). I need to create another biased sample from the same dataset and keep the same distributions for both of these variables. Here's my drawing of the situation:

enter image description here

So far I only managed to think of something like splitting all observations into bins, figuring out the number of observations I need in each bin in order for the distribution of the new sample to look like the distribution from the first one (for both variables) and then going through the dataset looking at each user like:

  • this one is bin 3 for logins but bin 1 for revenue, check
  • this one is bin 2 for logins and bin 1 for revenue, check
  • this one is bin 4 for logins and bin 1 for revenue, but bin 1 for revenue is full so it goes nowhere... until all the bins are full.

But this seems tedious, naïve and possibly incorrect. What would be the correct way to do what I want?

$\endgroup$
2
  • 1
    $\begingroup$ What is the point of your analysis? What are you trying to study? If you are simply trying to draw observations from a similarly biased dataset and not really interested in some more complicated analysis, why not just create bootstrap samples by drawing, with replacement, from your original dataset to multiple datasets of the same size as your original? $\endgroup$ Commented Sep 5, 2020 at 0:48
  • $\begingroup$ Hi! I added the drawing to show the difference between the original dataset and the sample 1. If I draw randomly from the original dataset, I will have distributions of the variables from the original dataset. I need distributions from the sample 1, drawing from the original dataset. Basically bootstrapping is exactly what I’m envisioning but I need to introduce bias myself. $\endgroup$
    – anywhere
    Commented Sep 5, 2020 at 7:07

1 Answer 1

0
$\begingroup$

If all you are trying to do is create another dataset that has a similar distribution to your existing dataset with similar covariances, variances, etc. then you could simply draw a single bootstrap sample, by sampling with replacement from your original dataset.

Here's a quick example in R. Say your data looks like the data in mydata.

#Generate some fake data for demonstration
logins<-rpois(1000, lambda=2)
revenue<-rnorm(1000, 500, 20000)
mydata<-data.frame(logins, revenue)

#examine distributions of the data with historgrams
hist(mydata$logins)
hist(mydata$revenue)

#Draw 1000 samples with replacement from the existing dataset
simulated.data<-mydata[sample(NROW(mydata), size=1000, replace = TRUE),]

#Verify that the resulting distribution looks similar to the original
hist(simulated.data$logins)
hist(simulated.data$revenue)

When you do this, you'll see that the distributions of both the original data and simulated data look very similar. But I suspect you are trying to do something more complex with your analysis. If you can tell us what you are trying to do, I can update this answer with better guidance.

$\endgroup$
4
  • $\begingroup$ Yeah, it's a bit more complex. The thing is that I have a dataset that smb updated every week and used to draw samples for many weeks without ever thinking of a control group. By the plan the leftovers in the original dataset were supposed to be the control group. I'm not sure I can express this all in a text, but after I inherited this wonder we kinda managed to significantly reduce bias that appeared due to leaking information from the future (leftovers were not chosen for many weeks because they stopped qualifying at some point). $\endgroup$
    – anywhere
    Commented Sep 5, 2020 at 7:42
  • $\begingroup$ But unfortunately the key distributions before the test are veery slightly off between the test group 1 (sample 1) and the leftovers list. Since we thoroughly controlled for all the future events, we see no other way than to draw many bootstraps from the leftovers list replicating the test distribution, then comparing them to the test many times and taking the mean result as a result. $\endgroup$
    – anywhere
    Commented Sep 5, 2020 at 7:42
  • 1
    $\begingroup$ So, if I understand you correctly, it sounds like you are trying to create a control group from your data because no control was ever really created, is that the case? If my understanding is correct, then you have observational data that needs to be compared. The best way to probably approach this then is to use something called propensity score analysis--a causal inference technique. Using this you basically randomly select observations matched to controls in a statistical sense (i.e. each control and treated observation have the same propensity to be assigned treatment)... $\endgroup$ Commented Sep 5, 2020 at 18:35
  • $\begingroup$ And then you carry out your analysis on the matched controls and treated cases. The analysis will allow you to then estimate your treatment effect. If my understanding is totally off, then I suggest you edit the main question to provide additional details. $\endgroup$ Commented Sep 5, 2020 at 18:35

Your Answer

By clicking “Post Your Answer”, you agree to our terms of service and acknowledge you have read our privacy policy.

Not the answer you're looking for? Browse other questions tagged or ask your own question.