Apologies upfront! I know that similar questions have been asked before but I still can't wrap my head around it / I would like to have further clarification.
Let's have a look at the following time-series data:
      date percentage
      <mth>      <dbl>
 1 2015 Jul      0.360
 2 2015 Aug      0.326
 3 2015 Sep      0.307
 4 2015 Oct      0.337
 5 2015 Nov      0.293
 6 2015 Dec      0.393
 7 2016 Jan      0.278
 8 2016 Feb      0.331
 9 2016 Mar      0.330
10 2016 Apr      0.314
# … with 55 more rows
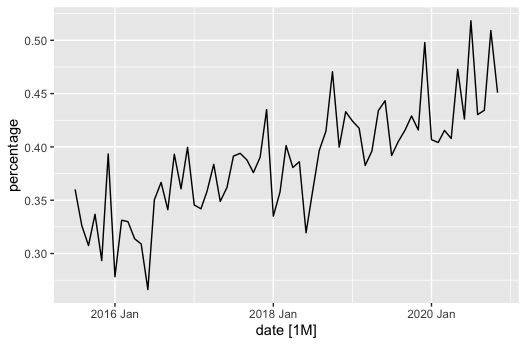
percentage gives the share of how often a class of website got visited (0/1) i.e. in July 2015 the share of 1's visited was 36% in August 32.6% and so on ...
If you are plotting the complete data-set it looks something like this i.e. for the naive observer, a clear trend might be visible. My questions now are (with a focus on the first one):
(1) Did the percentage of class 1 websites significantly increase over time? (2) The percentage of class 1 websites viewed increased by at least X%
This is very similar to a question asked earlier: How to calculate the confidence that a trend in a time-series is positive?
However, the answer to this question hasn't been accepted and I don't know whether modelling the problem as a logistic regression would be reasonable in my case. Moreover, the second post in this question links to the following question: Determining trend significance in a time series
In this thread, one post suggested that using auto.arima() or more precisely regression with arima errors from the forecast package could be used to answer this question. However, I fail to see how this works/how the coefficient of such a regression can be interpreted whether it is a significant increase and by which % value. I also don't want to do forecasting. I just want to make a statement of whether there is a significant trend or whether this is random.
Moreover when trying this with my data using auto.arima() and its grid search would yield a completely different model than adding the time as regression parameters:
auto.arima(ts_test) vs. auto.arima(ts_test,xreg=t)
ts_test
ARIMA(0,1,1)(1,0,0)[12]

Coefficients:
          ma1    sar1
      -0.7871  0.3019
s.e.   0.0731  0.1541

sigma^2 estimated as 0.001219:  log likelihood=123.88
AIC=-241.75   AICc=-241.35   BIC=-235.28
auto.arima with xreg
Series: ts_test
Regression with ARIMA(0,0,0) errors

Coefficients:
      intercept    xreg
         0.3147  0.0022
s.e.     0.0079  0.0002

sigma^2 estimated as 0.001029:  log likelihood=132.35
AIC=-258.7   AICc=-258.3   BIC=-252.17
So one can see that auto.arima uses quite a complex model with seasonal features, which the regression doesn't. Would this mean that I should do this manually? i.e. define the model like the first one and do the regression like this?
To be honest, I would rather try to avoid a complex approach like arima modelling, so could there not be an easier way to answer my initial questions (significant trend, what %) or if not how can I extract that from arima?
Looking forward to insights!

