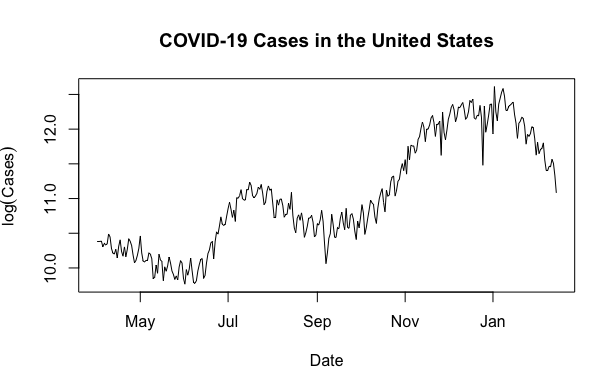
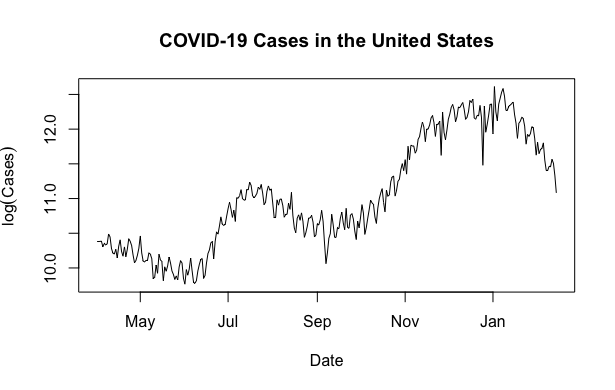
I am trying to remove the trends by differencing this logarithmically transformed time series. It contains two columns about COVID-19 Cases in the United States: one column being the number of cases and the other column being the date [https://github.com/CSSEGISandData/COVID-19/tree/master/csse_covid_19_data/csse_covid_19_time_series]
I tried differencing my logarithmically transformed time series as shown below; however, the lines look very odd. R gives me a warning message Warning message: In log(casesDifferenced) : NaNs produced, and I think this is due to the log transformation because when I try to plot my values without the log transformation, the plot is fine.
Could someone explain what is happening here? Does this second plot do an adequate job of removing the trends by taking the first difference?
casesDifferenced <- diff(dat$new.cases, differences=1)
newDate <- dat$date[2:length(dat$date)]
plot(as.Date(newDate,"%m.%d.%y"), log(casesDifferenced), type = "l",
     xlab = "Date", ylab = expression(log("Differenced Cases")),
     main = "Differenced Time Series with Log Transformation d = 1")


