3
$\begingroup$

I'm exploring some manual approaches to understand whether specific changes on a site can be deemed conclusive and statistically significant.

I appreciate that any A/B testing platform has a reporting part of doing this job; however, changes have been implemented without any platform, so my best bet was pulling out data and doing this exercise manually.

The scenario

36 pages, 24 of which have a feature the remaining 12 have not.

Looking at the daily traffic values, traffic rose by +50% on the group where the feature is in. But I need to provide a confidence interval or a statistically significant coefficient for the senior management.

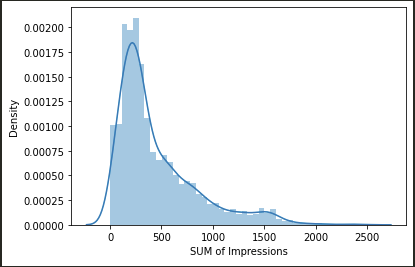
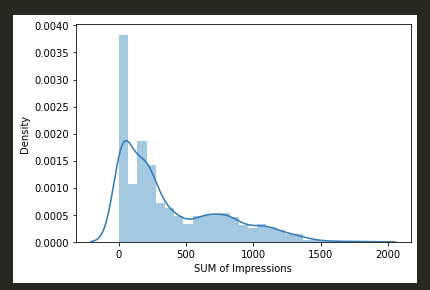
The two groups of data (8760 & 4380 entries respectively) are heteroscedastic (Levene test suggests it) and not normally distributed (after all they are traffic data).

enter image description here

enter image description here

Note: I believe the data are not normally distributed as the bell curve is not properly centered, but I might be wrong in saying so. Still have to gain experience in this field.

The result

When running a Welch's test as below, I get a p-value that is absnormal:

stats.ttest_ind(faq['traffic'], no_faq['traffic'], equal_var=False, axis=0)

Ttest_indResult(statistic=-23.253270956567135, pvalue=1.3551062210749643e-114)

Now, if the H0 is that the page feature does not influence the traffic, the high p-value here confirms me the opposite.

Question

What I'm struggling to understand is the very high p-value that goes beyond the 100% mark. Am I doing something wrong? Should I use a different test? What to calculate a confidence score?

$\endgroup$
2
  • 2
    $\begingroup$ "What I'm struggling to understand is the very high p-value that goes beyond the 100% mark". But the p-value is close to zero !!! $\endgroup$ Commented Jun 16, 2021 at 16:15
  • $\begingroup$ If your data is non-normal, you may wish to reconsider the use of an independent Welch's test. See this Q/A. $\endgroup$
    – Galen
    Commented Jun 16, 2021 at 16:16

2 Answers 2

2
$\begingroup$

You're saying the p-value is really high, but it is the opposite. Your p-value is really small, but you may be overlooking the scientific notation.

$P=$1.3551062210749643e-114$ = \frac{1.3551062210749643}{10^{114}} \approx \frac{1}{10^{114}} << 0.05 = \alpha$

$\endgroup$
8
  • $\begingroup$ I am possibly doing so, have still few concept of statistic that I need to grasp well. So given is so small... the null hypothesis is confirmed, so there is no evidence the new features have had any effect? How else can I explain/explore this? $\endgroup$ Commented Jun 16, 2021 at 16:09
  • 1
    $\begingroup$ $P<\alpha$ means you will reject the null hypothesis. $\endgroup$
    – Galen
    Commented Jun 16, 2021 at 16:10
  • $\begingroup$ Actually, you're right, I was too focused in reading the other way round. So, correct me whether I'm wrong, I basically have 100% of statistical significance. Should I add anything else for the sake of communication? BTW appreciated the other link $\endgroup$ Commented Jun 16, 2021 at 16:21
  • $\begingroup$ @AndreaMoro Non-normality of the data notwithstanding, the interpretation of your Welch test is that the two groups are significantly different under an 95% confidence. $\endgroup$
    – Galen
    Commented Jun 16, 2021 at 16:26
  • $\begingroup$ @AndreaMoro For communication, I suggest you include visualizations that show what your statistics are indicating. It might seem redundant, but it can really clarifying what the stats are saying to your target audience. $\endgroup$
    – Galen
    Commented Jun 16, 2021 at 16:28
1
$\begingroup$

You are testing whether 2 independent samples have the same expected values.

"What I'm struggling to understand is the very high p-value that goes beyond the 100% mark".

The p-value is low, not high. As for interpretation: If these two samples actually have the same expected value, then the probability of observing these data, or data even more extreme, is very low.

It would be a good idea to check if these data are approximately normally distributed.

$\endgroup$
5
  • $\begingroup$ How can I check for normal distribution if the data are split by page and date? I don't think this is possible. I can group by date, but the overall result is still a time series. The only way I can think is to group by the value I'm testing and add a count every time a given item is found? $\endgroup$ Commented Jun 16, 2021 at 17:52
  • $\begingroup$ @AndreaMoro You should be able to check whether faq['traffic'] and no_faq['traffic'] are normally distributed. $\endgroup$
    – Galen
    Commented Jun 16, 2021 at 19:16
  • $\begingroup$ I'm not sure why page and date have anything to do with the distribution ? Perhaps you can post a plot of the histograms of both samples. ie if using matplotlib then hist() or histogram() in numpy. $\endgroup$ Commented Jun 16, 2021 at 20:01
  • $\begingroup$ All I mean is that - by nature - those values are unlikely to be normally distributed because I have an uplift. But thinking to it more rationally, this might not always be the case. So I did update the post above to include a couple of chart just for completeness. $\endgroup$ Commented Jun 17, 2021 at 7:56
  • $\begingroup$ Does this answer your question ? If so please consider marking it as the accepted answer. If not, please let us know why. Also, if you haven't already, please consider upvoting it. $\endgroup$ Commented Jun 26, 2021 at 12:21

Your Answer

By clicking “Post Your Answer”, you agree to our terms of service and acknowledge you have read our privacy policy.

Not the answer you're looking for? Browse other questions tagged or ask your own question.