0
$\begingroup$

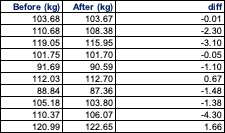
I have the following data from a weight loss survey from a diet program.

enter image description here

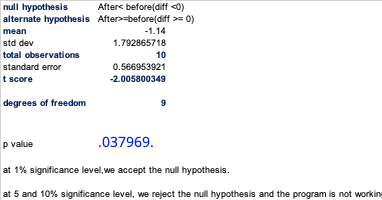
I calculated the following things from the data and formulated my null hypothesis and alternate hypothesis as follows.

enter image description here

My question is what changes in the above if I simply exchange the null and alternative hypotheses. Mean, std dev, standard error, and t score remain the same right? Hence consequently p-value also remains the same. Hence I am not sure how the conclusions are affected.

Can someone please help me with what exactly did I miss here and what parameters would change and why? (If some graphical representation is possible, then I would be grateful)

$\endgroup$
1
  • $\begingroup$ Typically, the null hypothesis should state that there is no effect (here, diff = 0) and the alternative hypothesis should state that it does not equal the null hypothesis... therefore, if you can reject the null hypothesis and favor the alternative hypothesis. Here, your alternative hypothesis seems incorrect since looking at your data After <= Before in general. So, I encourage you first to set up properly your hypothesis. H_0: there is no effect and H_a: After <= Before $\endgroup$
    – Pitouille
    Commented Aug 19, 2021 at 12:16

1 Answer 1

1
$\begingroup$

If you are looking at the weight loss (difference Before - After), then indeed the mean, standard deviation, standard error and test statistic value won't change. However, the p value - and how to interpret it depends - on what you want to demonstrate, i.e. the null / alternative hypothesis.

In your example, looking at the data it seems that we can observe weight loss in general. In order to stick to your example, we will keep the one-sample t-test approach. So, you might want to formulate your hypotheses as follows:

$H_0:$ diff = 0

$H_1:$ diff < 0

In other words, you are looking at the probability to obtain the effect observed in your sample if the null hypothesis is correct.

Here we are looking at a lower-tailed test, i.e. the probability that the test statistics is less than (or equal) our calculated t value (pink region in the picture below). The p-value is equal to the cumulative distribution of the test statistic (CD). In your example, p-value = 0.0379

If we set our hypotheses in the other way round:

$H_0:$ diff = 0

$H_1:$ diff > 0

then we are looking at a upper-tailed test, i.e. the probability that the test statistics is greater than (or equal) our calculated t value (blue region in the picture below). In this case, the p-value is equal to one minus the cumulative distribution of the test statistic: 1 - CD. In your example, p-value = 0.962
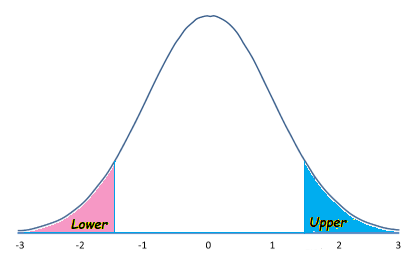
enter image description here

$\endgroup$

Your Answer

By clicking “Post Your Answer”, you agree to our terms of service and acknowledge you have read our privacy policy.

Not the answer you're looking for? Browse other questions tagged or ask your own question.