1
$\begingroup$

I want to perform a very large number of Mann-Whitney U-tests between many groups from data that I will get in from a database.

I would prefer to use a pre-implemented version of this test.

I think that I have three options:

  1. Perform the U-test on the database server.
  2. Pull all data from the server and perform locally.
  3. Pull a "histogram compressed" version of the data and perform the tests locally.

Thoughts on these options:

  1. I don't like the idea of writing my own Mann-Whitney U procedure in Postgres. I am not a statistician nor a DB expert and bugs seem likely.
  2. I don't like the option of pulling a very huge amount of data from the server. However, this would let me use a simply stats package in Python and keep the "statistics good"
  3. To clarify what I mean -
  • I can have a full dataset:
  • [x1,x2,x3,....xn]
  • But I could also "compress" that data by taking a histogram of it. In this case, I could show the data as
  • [bin_location_1*numer_of_points_in_bin_1, etc]

I like this approach because it greatly compresses the info that I take from the database, but I worry that I would "lose information" that might invalidate the U-test.

Thoughts?

$\endgroup$
2
  • $\begingroup$ While reading your Question a similar idea to @ThomanLumley's (+1) came to mind. His idea ought to work. For large samples, the two-sample version of wilcox.test in R is not too fussy about ties. My brief supplementary demo in Answer format is below. (I hope you will accept his Answer.) $\endgroup$
    – BruceET
    Commented Feb 2, 2022 at 5:13
  • $\begingroup$ I would think no. Doesn't the significance of the result depend on the sample size? To see this, try sampling n=1e3 and n=1e9 samples from the histograms, and compute the p-value. note: the distributional differences are, by definition, identical. but the p-values will be different. Someone please correct me if I'm wrong here! $\endgroup$ Commented Feb 22, 2023 at 14:18

2 Answers 2

2
$\begingroup$

You can't just multiply the bin location by a count; those are different sorts of things. What you can do is reconstruct in memory a data set that has points at the bin locations with the number of copies of the point being the count -- you need to transfer both the bin locations and the counts from the server. Depending on your implementation, you might be able to just pass the locations and counts ('weights') to code that works out the Mann-Whitney test for the implied complete data set, or you might not. You'd need to check whether the function accepts weights and how it interprets them.

Even with explicit or implicit data re-expansion you will lose information. How much depends on how wide the histogram bins are (compared to the size of shift you are aiming to be able to detect).

There are two reasons you lose power in the test.

  • the test is based on rank ordering of observations, and you don't know the relative ranks of observations in the same bin
  • for technical reasons, the test (at least as usually implemented) is conservative when there are multiple observations at the same value

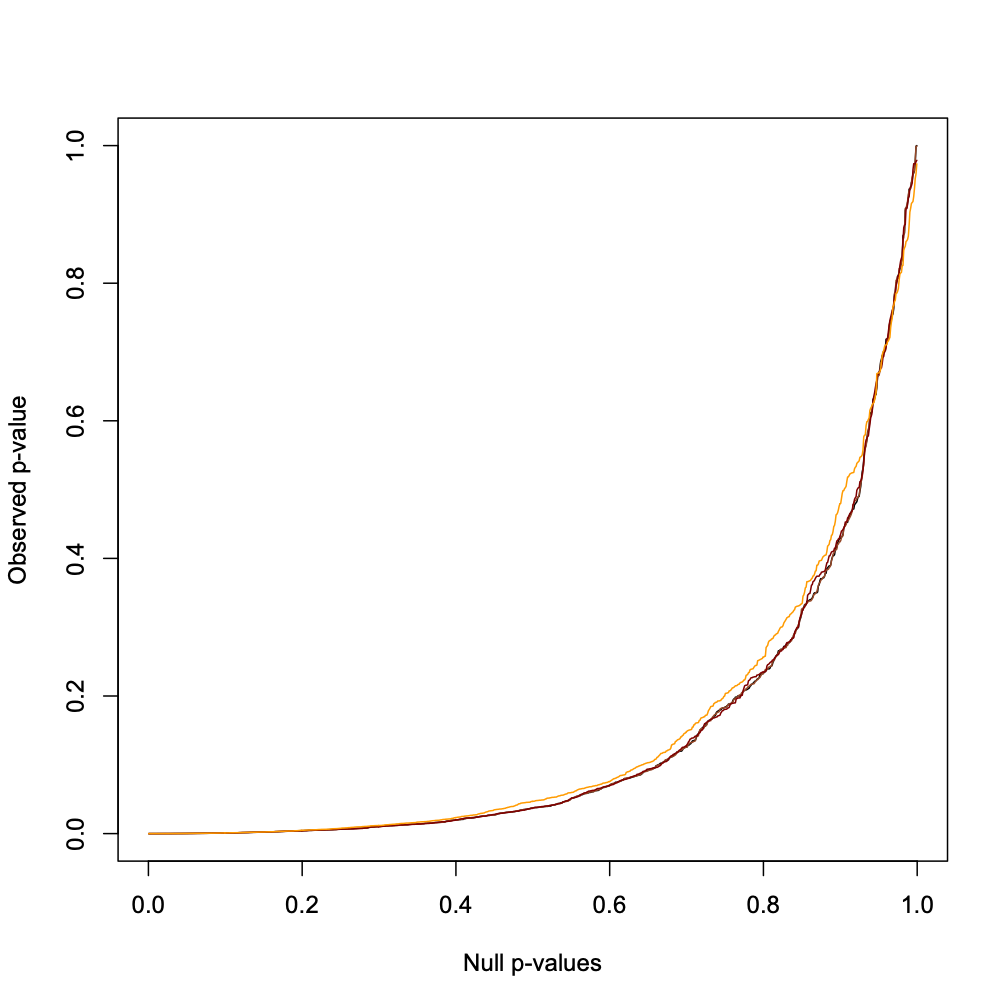
The loss of power seems to be surprisingly small in one experiment I tried; you could do others that were more suited to your data.

This one has 100 $N(0,1)$ vs $N(0.3,1)$, with 1000 replicates. I tried the original data, and rounded to 2, 1, and 0 decimal places. The $p$-value distributions are different, but they aren't that different


 r<-replicate(1000, {
 x<-rnorm(100)
 y<-rnorm(100)+.3
 c(
wilcox.test(x,y)$p.value,
 wilcox.test(round(x,2),round(y,2))$p.value,
 wilcox.test(round(x,1),round(y,1))$p.value,
wilcox.test(round(x),round(y))$p.value
)})


plot(ppoints(1000),sort(r[1,]),type="l",xlab="Null p-values",ylab="Observed p-value")
lines(ppoints(1000),sort(r[2,]),col="sienna")
lines(ppoints(1000),sort(r[3,]),col="darkred")
lines(ppoints(1000),sort(r[4,]),col="orange")

enter image description here

$\endgroup$
1
  • 1
    $\begingroup$ Thanks for the perspective and preliminary testing. $\endgroup$
    – a_chemist
    Commented Feb 2, 2022 at 3:08
0
$\begingroup$

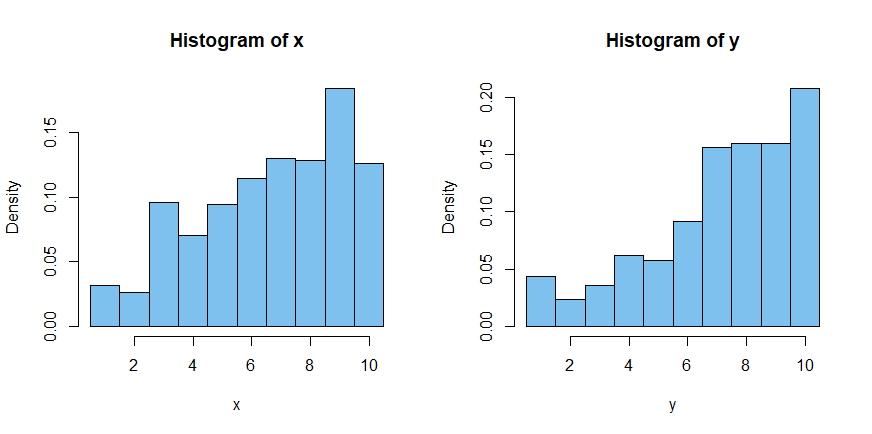
Comment continued: Demo using repeated values at histogram midpoints:

set.seed(2022)
x = sample(1:10, 500, rep=T, p=c(1,1,2,2,3,3,4,4,5,5))
y = sample(1:10, 500, rep=T, p=c(1,1,1,2,2,3,3,4,4,5))

summary(x)
   Min. 1st Qu.  Median    Mean 3rd Qu.    Max. 
  1.000   5.000   7.000   6.656   9.000  10.000 
summary(y)
   Min. 1st Qu.  Median    Mean 3rd Qu.    Max. 
  1.000   6.000   8.000   7.182   9.000  10.000 

Very roughly speaking ys are shifted one unit to the right of xs.

par(mfrow=c(1,2))
cutp=seq(.5,10.5,by=1)
 hist(x, prob=T, br=cutp, col="skyblue2")
 hist(y, prob=T, br=cutp, col="skyblue2")
par(mfrow=c(1,1))

enter image description here

Of course, there are very many ties. The 'relative ranks of observations in the same bin' are the same.

length(unique(x))
[1] 10
length(unique(y))
[1] 10

However, wilcox.test in R handles ties without difficulty.

wilcox.test(x,y)

        Wilcoxon rank sum test with continuity correction

data:  x and y
W = 108690, p-value = 0.0003134
alternative hypothesis: 
  true location shift is not equal to 0
$\endgroup$

Your Answer

By clicking “Post Your Answer”, you agree to our terms of service and acknowledge you have read our privacy policy.

Not the answer you're looking for? Browse other questions tagged or ask your own question.