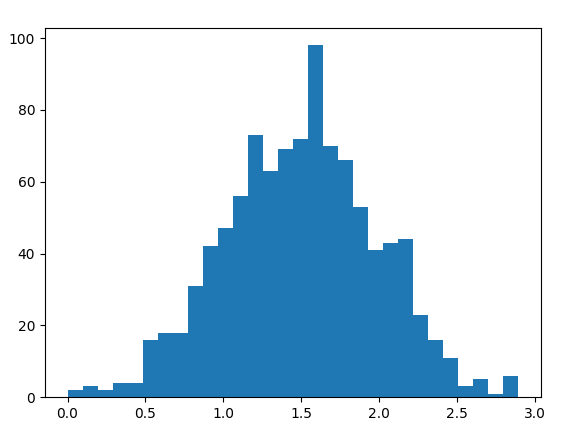
I would like to test following. Suppose I have a normal distribution with mean 1.5 and sigma 0.5 on interval [0, 3]. Python code:
import numpy as np
import matplotlib.pyplot as plt


mu = 1.5  # mean
sigma = 0.5  # standard deviation
n = 1000  # number of samples

# generate normally distributed random numbers with mean mu and standard deviation sigma
samples = np.random.normal(mu, sigma, n)

# shift and scale the samples to the range 0 to 3
samples = np.clip(samples, 0, 3)
Histogram looks like this:
But now I add one peak around x = 1.96 and my histogram looks like this now:
Python code for generating this peak is:
n = 70  # number of samples

# generate uniformly distributed random numbers between 0 and 1
added_samples = np.random.rand(n)

# scale the samples to the range 1.96 to 1.99
added_samples = 1.96 + added_samples * (1.99 - 1.96)


all_together = np.append(samples, added_samples)
My question is, if there is a statistical test or algorithm that can check for normally distributed data with "one peak"? Some modification of shapiro-wilk test or something.. Thanks a lot.
EDIT: What we know beforehand:
- Peaks can be only in three points, lets say x = 1.5, x = 1.96 or x = 2.5. We would like to test if there is really a peak in any of these x.
- We know the mean and standard deviation of the new sample = that is after the peak is present.
- The additional data are uniformaly distributed around the interval [x, x + 0.03] (that is [1.5,1.53], [1.96,1.99] or [2.5, 2.53])


but other than that piece which doesn't fit with my hypothesis, how does the rest look?. $\endgroup$