6
$\begingroup$

Let's say I must taste and rank 4 bottles of wine by price. The true ranking is [X,Y,Z,W]. The ranking I provide after tasting is [X,Y,W,Z], where X,Y,Z,W are different bottles of wine. Which statistical approach, which test could I perform to get the probability that my answer is fully random vs "approaching" the true ranking?

While I am writing I had perhaps an idea.. I define a loss function, I compute the loss of my answer and then I simulate random answers and see how many of them have a loss higher than my answer... however this depends on the choice of the loss function..

I think the general idea is to test if some data has a given known structure.

$\endgroup$
3
  • $\begingroup$ Is your true ranking known? $\endgroup$ Commented Oct 18, 2023 at 9:26
  • $\begingroup$ @StephanKolassa: yes $\endgroup$
    – Antonello
    Commented Oct 18, 2023 at 9:28
  • $\begingroup$ I've given a fairly detailed answer to this type of problem previously here: stats.stackexchange.com/questions/530249/… $\endgroup$
    – awhug
    Commented Oct 19, 2023 at 1:40

5 Answers 5

8
$\begingroup$

Here is one possibility. Note that rankings are permutations, so searching for that term might be useful.

First, select a notion of "approaching" between rankings/permutations, i.e., select a distance between two permutations. For instance, you could use the minimum number of transpositions to change one permutation to the other, or the minimum number of transpositions of adjacent elements. Note that these are different notions of distance. (You can of course let your choice be guided by what distance between permutations is implemented in your software of choice.)

Calculate the distance between the true ranking, and your provided ranking.

Now, simulate many possible rankings, i.e., pick many random permutations. In your specific case, there are only 24 possible permutations, so you could go over them exhaustively, but for larger sizes, this quickly becomes infeasible.

For each random permutation, calculate and store its distance to the true ranking.

To obtain a p-value against the null hypothesis that your provided ranking is closer to the true ranking than might be expected by chance, check how many of the randomized distances are smaller than the distance of your provided ranking.
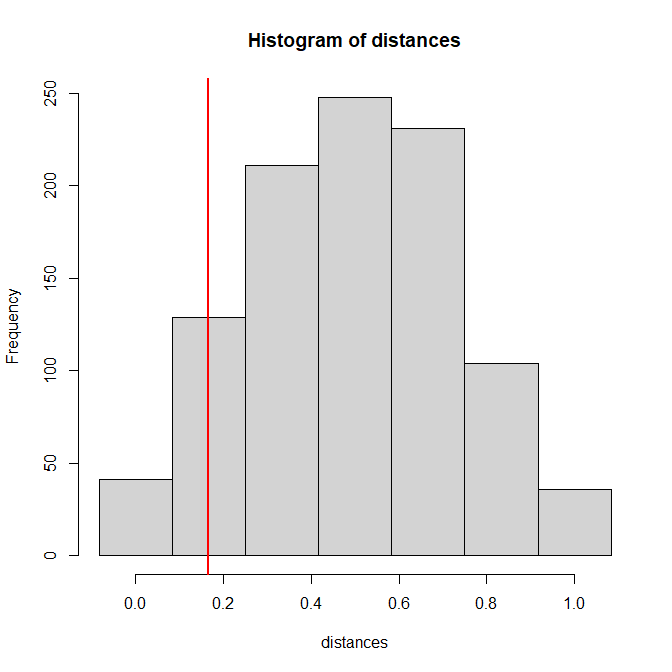
histogram

R code:

library(CEGO)

true_ranking <- c(2,3,4,1)
provided_ranking <- c(2,3,1,4)
provided_distance <- distancePermutationSwap(provided_ranking,true_ranking)

n_sims <- 1000
distances <- rep(NA,n_sims)
for ( ii in 1:n_sims ) {
    set.seed(ii)    # for reproducibility
    perm <- sample(seq_along(true_ranking),length(true_ranking))
    distances[ii] <- distancePermutationSwap(perm,true_ranking)
}
ecdf(distances)(provided_distance)  # p-value
dd <- min(diff(as.numeric(names(table(distances)))))
hist(distances,breaks=seq(-dd/2,1+dd/2,by=dd))
abline(v=provided_distance,col="red",lwd=2)
$\endgroup$
1
  • $\begingroup$ +1, that's the way. I would though comment that "rankings are permutations" is a bit aphoristic. Rankings represent preferences so using a slightly more informed metric (e.g. NDCG) is more appropriate. I made a little answer on that point. $\endgroup$
    – usεr11852
    Commented Oct 18, 2023 at 20:30
6
$\begingroup$

With 4 bottles there are only 24 possible rankings, so if you wanted to test at 5% level, the only possibility to reject random ranking would be to get the ranking exactly right (prob. 1/24). Testing at 1% level is impossible, there are simply not enough possibilities for outcomes. Note in particular that no test will give you a "probability that your answer is fully random"; the only thing a test can do is to see whether there is clear evidence against it. For finding the said probability you'd need a Bayesian approach and specify a prior probability for your ranking being "fully random" (and also prior probabilities for all kinds of other possibilities, which may be very tedious).

With more than four bottles you could use the Kendall tau distance between the rankings as loss. Chances are that at least for a low number of bottles one can compute precisely (by complete enumeration of all possibilities if all else fails) a p-value for a test that rejects randomness if your ranking is "too close" to the true one (which basically amounts to your idea but without simulation; if numbers become prohibitive, of course simulation is an option as in Stephan Kolassa's answer).

$\endgroup$
2
$\begingroup$

(This started as a comment.)

In the context of measuring the "goodness of rankings" we have several ranking quality measurements. One of the most prominently used is the Normalized Discounted Cumulative Gain (NDCG), NDCG is extensively used in recommender systems and loosely speaking it incorporates the notion of that item that are higher in the (true) ranking should be given more credit than items that are lower in the ranking list. I would use that over a standard permutation distance (as in Stephan's answer - upvote for the general framework presented though).

$\endgroup$
1
  • $\begingroup$ Nice, but it assumes indeed that precision in the top of the ranking is more important that that at the bottom end. That's ok for search engine results of if the ranking is to determine prizes, but not in general.. I may be interested also if I am good in recognising bad wine bottles :-) $\endgroup$
    – Antonello
    Commented Oct 19, 2023 at 8:47
1
$\begingroup$

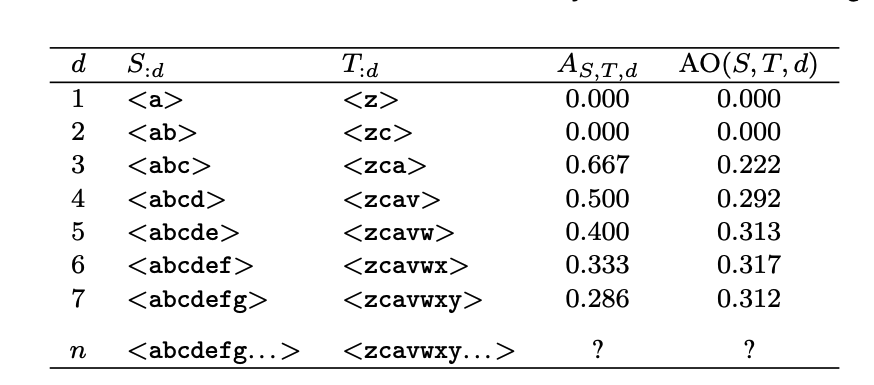
Another option I have used with some success is to do a permutation test on a test statistic that measures the degree of overlap between the truth and your ranking. One good measure is Average Overlap at Depth d:

enter image description here

It’s defined by calculating the overlap size so far at each depth d and then taking the average of those. AO at d can handle non-conjoint lists and weights high-rank overlap more heavily than low-rank.

In your example, AO at depth 4 is 0.917 on a $[0,1]$ scale. That is the second-highest overlap value in the set of all 24 possible permutations. You can treat that as an exact p-value of 0.083, so it is reasonably strong evidence against the null of random.

In contrast, had your ranking been $<YXZW>$ -- swapping the top two from the ground truth -- the p-value would be 0.2917.

I would be curious to get some feedback on the merits of this approach. I don’t quite understand why the choice of distance function makes such a big difference compared to the two approaches.

A good reference for AO at d, as well as other related measures, is:

William Webber, Alistair Moffat, and Justin Zobel. 2010. A similarity measure for indefinite rankings. ACM Trans. Inf. Syst. 28, 4, Article 20 (November 2010), 38 pages. https://doi.org/10.1145/1852102.1852106

$\endgroup$
0
1
$\begingroup$

This Julia code applies the simulation approach of my own hint and the answers of Stephane Kolassa and Christian Hennig.

Having compared several cases on both his R code and this code, results are mostly similar, the small differences seem to arise from the difference in the distance definition (simple l-2 loss on the ranking position in my case, count of permutation swaps in distancePermutationsSwap) and in the small sampling used in R:

using Random
simsize = 100000
function loss(x,y)
    pos_x = 1:length(x)
    pos_y = [findfirst(i -> i == c, y) for c in unique(x)]
    return sum((pos_x .- pos_y) .^2 )
end
function loss_quantile(lx,true_rank,simsize)
    n_lower_loss = 0
    n            = length(true_rank)
    for _ in 1:simsize
        l = loss(true_rank,shuffle(1:n))
        (l <= lx) && (n_lower_loss += 1)
    end
    return n_lower_loss/simsize
end
function compute_pvalue(true_rank,test_rank,simsize)
    Set(unique(true_rank)) == Set(unique(test_rank)) || error("Different elements in the two vectors")
    length(true_rank) == length(test_rank) == length(unique(true_rank)) || error("Non unique elements")
    l = loss(true_rank,test_rank)
    return loss_quantile(l,true_rank,simsize)
end
true_rank     = [2,3,4,1]
my_rank       = [2,3,1,4]
p_value = compute_pvalue(true_rank,my_rank,simsize)

Note that with definition of distance the probability of wrongly claiming an effect of the true ranking on my ranking is the same whatever I test [2,3,1,4] ("mistake" at the end of the sequence) rather than [3,2,4,1] ("mistake" at the beginning of the sequence).

$\endgroup$

Your Answer

By clicking “Post Your Answer”, you agree to our terms of service and acknowledge you have read our privacy policy.

Not the answer you're looking for? Browse other questions tagged or ask your own question.