I am looking at a model trained with stochastic gradient variational Bayes. In this paper an importance sampler is proposed to estimate the likelihood:
$$p(x) \approx {1 \over S} \sum_{s=1}^S {p(x|z_s) p(z_s) \over q(z_s|x)}$$
with $h_s \sim q(z_s|x)$.
It is not entirely necessary what the quantities mean in order to understand the question, but I will give some info. We are looking at a graphical model of the form $z \rightarrow x$, with $z$ being continuous. The map from $z$ to $x$ is a nonlinear regressor representing a conditional distribution $p(x|z)$. $p(z)$ on the other hand is just a prior. $q(z|x)$ is a "recognition model", which approximates the intractable $p(z|x)$ with another nonlinear regressor. Consider that these distributions are given and fixed, their estimation is a different matter--it is a variational method which also gives us an upper bound on the negative log-likelihood.
Now, it seems I have reproduced the results on their models and one data set. Yet, I have two practical questions.
1) How to test an importance sampler? Since $p(x)$ is intractable, I guess it can only be done for small models. The route I went is to assert its correctness on factor analysis, where $p(x)$ is tractable and I made up a very simple $q(x|h)$.
2) The other question is that I am ultimately interested in the negative log-likelihood for comparative reasons. Thus I arrived at $$-\log p(x) = \log S - \log (\sum_{s=1}^S \exp(\log p(x|z_s) + \log p(z_s) - \log q(z_s|x)).$$
A nice side effect is that this quantity can be computed numerically stable with the log-sum-exp trick.
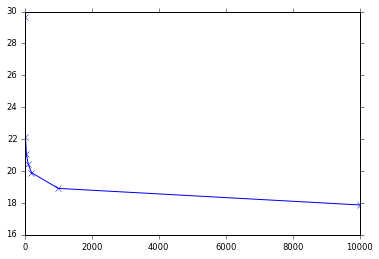
However, depending on the sample size $S$, I get the following results for my negative log likelihood:
1     -> 29.6682416864
20    -> 22.144055709761528
50    -> 21.067476078084795
100   -> 20.458267754505115
200   -> 19.901382220921288
1000  -> 18.911037074948325
10000 -> 17.8730836533

I do not understand this asymptotic behaviour. Does it make sense? Or is sth wrong in the deviation of the log-likelihood sampling.
Furthermore, I have an upper bound on that value, which is ~14. Thus, if everything is correct this should converge to a value lower than that.
