I'd like some help trying to understand if the conceptual question I'm asking makes sense, and if so, how I would go about implementing the statistics for it. I designed an experiment with two conditions, and my goal is to determine if these conditions are equivalent, i.e. are the measurements I take of a set of parameters equal across conditions.
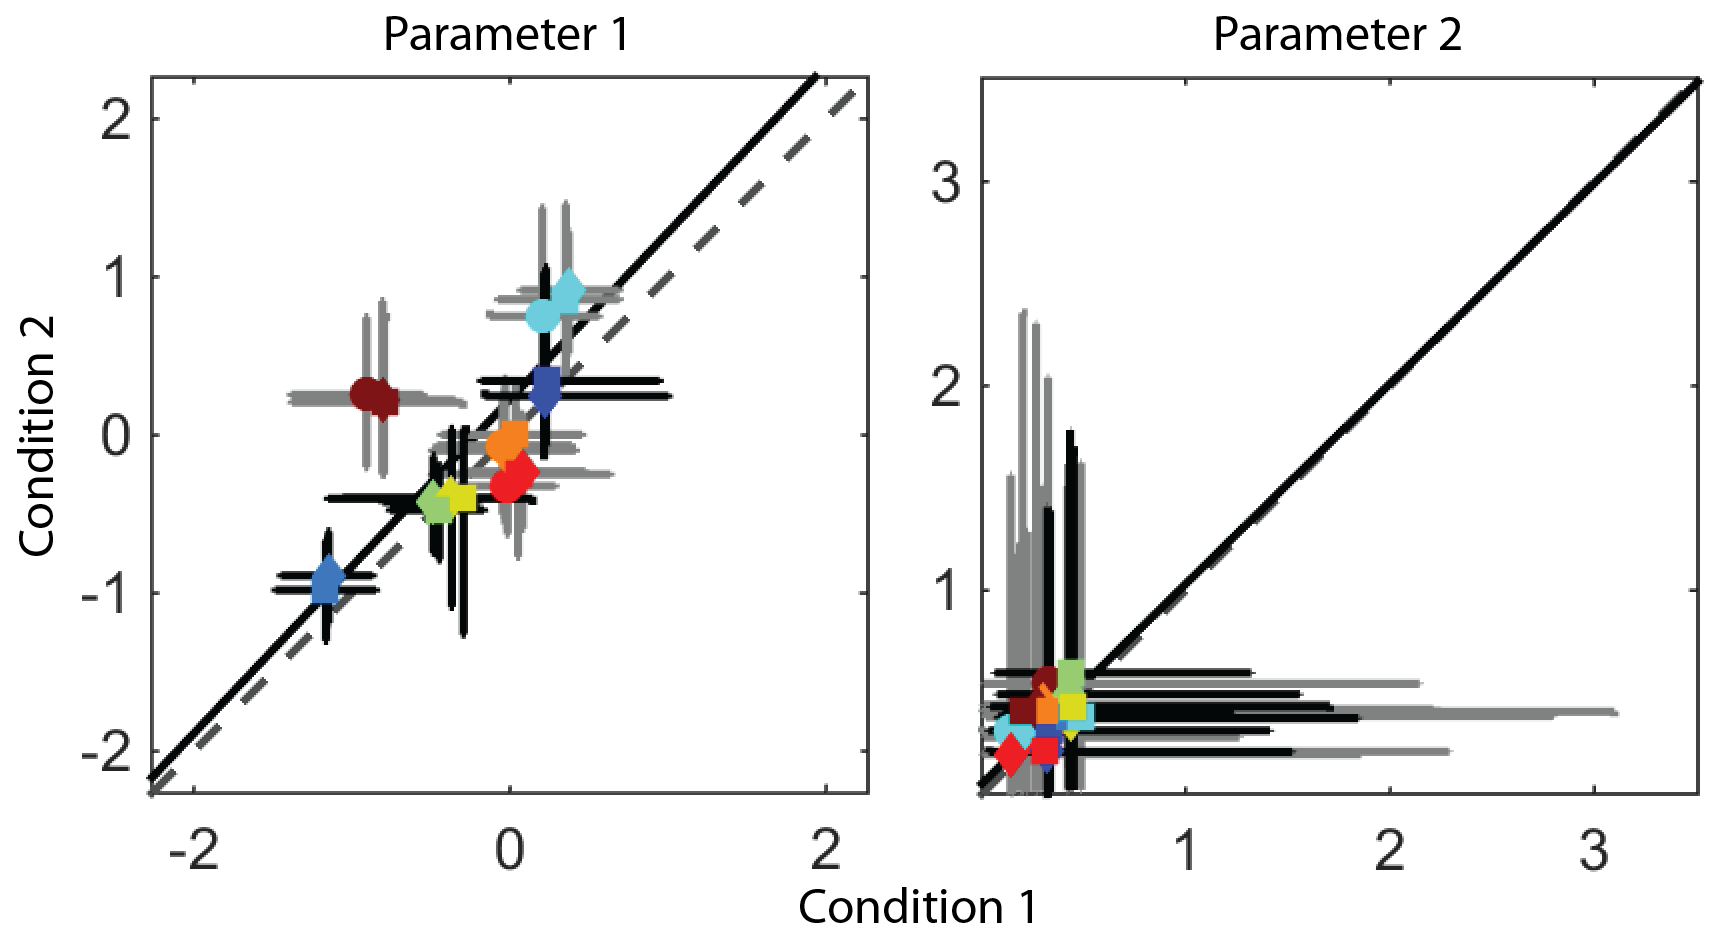
The approach I took for this experiment was to take 120 measurements in each condition across 8 subjects. With that data, I found the median value for each subject for each condition, and correlated median values over all subjects across the two conditions. This correlation is depicted in the following figure. Each colored point represents a median value for conditions 1 and 2 (I have multiple methods of estimating each parameter, so there are a few repeated points for each subject), and gray and black bars represent 95% confidence intervals for the parameter estimate in each condition. To determine if each parameter is correlated across conditions, I used standard regression across the median values to determine significance, and if so, fit a model II regression to the data to estimate the regression slope (depicted as a black line). Note that I have no guarantee that these parameters are normally distributed.

The approach I've described seems to be valid for parameter 1. The distribution of points for each subject is relatively small compared to the spread of medians across subjects, and so I would conclude that I have a good predictive ability across conditions for parameter 1. However, I get a bit confused looking at parameter 2. According to my analysis, I have a significant correlation between condition 1 and condition 2 for parameter 2, but I'm skeptical of the validity of this result because the confidence intervals are much larger than the spread of the medians. Intuitively, I would say that the data is too bunched up to be capable of giving me a meaningful correlation, but I'm not sure how to support or refute that claim.
I have a few questions about this analysis. First, is this the right approach to answer my conceptual question, "are measurements equal across conditions with in a subject?" Second, should I be concerned about the size of the confidence intervals vs the size of the median range for parameter 2? Third, is there an approach to this question that can incorporate the distribution of parameter values in each condition, rather than just the medians?
Thanks!
