I am using emcee to do inference on some data. I am trying to fit my data to a line of equation $ y = mx + b $.
# Initialize MCMC
ndim = 2 # number of parameters in the model
nwalkers = 100 # number of MCMC walkers
nsteps = 500 # number of MCMC steps
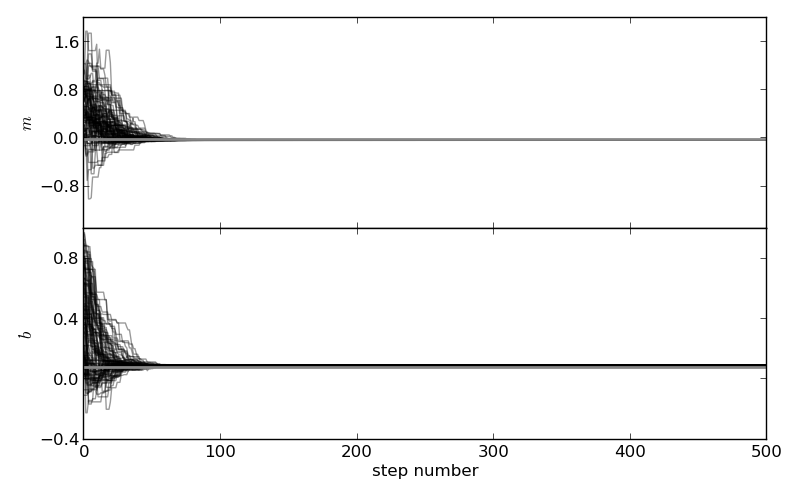
I did a plot to visualize the time series of the parameters in the chain. The figure below shows the positions of each walker as a function of the number of steps in the chain:

The gray horizontal line represents the values of m and b I got from doing classical linear regression without taking the uncertainties of my parameters into consideration.
My question is can I trust this graph? It converges "very quickly". According to some researches, I should burn-in approx the first half of the steps!
In order to better analyze this graph, I checked the acceptance fraction of each of the 100 walkers, the result is:
0.63   0.632  0.64   0.668  0.642  0.612  0.65   0.67   0.61   0.612
0.64   0.632  0.63   0.636  0.604  0.618  0.62   0.662  0.646  0.612
0.63   0.618  0.642  0.634  0.608  0.658  0.614  0.62   0.658  0.698
0.662  0.64   0.652  0.638  0.596  0.654  0.66   0.646  0.69   0.644
0.628  0.638  0.706  0.644  0.638  0.62   0.608  0.64   0.584  0.654
0.658  0.652  0.658  0.684  0.64   0.668  0.632  0.634  0.628  0.632
0.63   0.612  0.598  0.64   0.58   0.632  0.596  0.618  0.648  0.644
0.622  0.632  0.64   0.656  0.658  0.648  0.632  0.628  0.66   0.592
0.654  0.602  0.652  0.616  0.654  0.646  0.632  0.636  0.656  0.63
0.624  0.662  0.636  0.66   0.614  0.676  0.64   0.656  0.642  0.55
The acceptance rate should be between 0.25 and 50, right? It looks like my acceptance rate is higher than that.
I would like to know your opinion on this problem. Thanks!
Edit
I have 373 data points. And my likelihood is: $$ p(D|\theta) = \frac{1}{\sqrt{2\pi\sigma^2}}\exp{\frac{(y - mx - b)^2}{\sigma^2}} $$ where $\sigma$ represents the uncertainties in my $y$ data points.

emceeworks. So basically I am using uniform priors. $\endgroup$