20
$\begingroup$

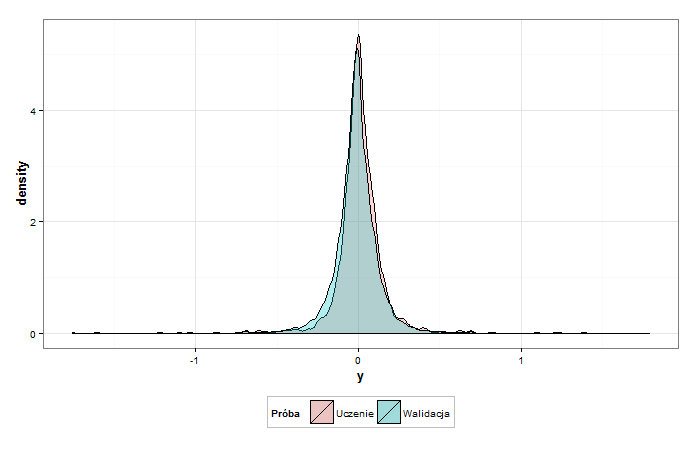
Why geom_density is showing me values higher than 1 in the density plot? How to change it into fraction?

enter image description here

And my code used to generate the plot

ggplot(data = input2, aes(x = r.close)) +
  geom_density(aes(y = ..density.., fill = `Próba`), alpha = 0.3, stat = "density", position = "identity") +

  xlab("y") + ylab("density") +
  theme_bw() +
  theme(plot.title=element_text(size = rel(1.6), face = "bold"),
        legend.position = "bottom",
        legend.background = element_rect(colour = "gray"),
        legend.key = element_rect(fill = "gray90"),
        axis.title = element_text(face = "bold", size = 13)) 
$\endgroup$
2
  • 3
    $\begingroup$ geom_density(aes(y=..scaled..)) $\endgroup$
    – hrbrmstr
    Commented Sep 13, 2015 at 16:36
  • $\begingroup$ Densities do not need to be less tahn 1. Probabilities do but probabilities are not defined for single points of continuous distributions. $\endgroup$
    – DWin
    Commented Oct 27, 2022 at 22:46

2 Answers 2

24
$\begingroup$

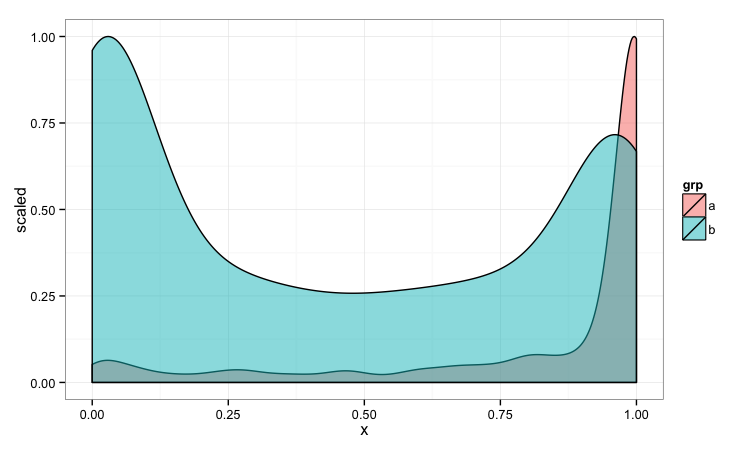
Or you can just used the computed ..scaled.. value stat_density provides:

library(ggplot2)

set.seed(1)
vals1 <- rbeta(1000, 0.5, 0.1)
vals2 <- rbeta(1000, 0.25, 0.3)

gg <- ggplot(data.frame(x=c(vals1, vals2),
                        grp=c(rep("a", 1000), rep("b", 1000))))
gg <- gg + geom_density(aes(x=x, y=..scaled.., fill=grp), alpha=1/2)
gg <- gg + theme_bw()
gg

enter image description here

$\endgroup$
2
  • 1
    $\begingroup$ Isn't the total area under the curve still higher than 1? $\endgroup$
    – Ben
    Commented Jul 6, 2020 at 8:53
  • $\begingroup$ Just beware that this scaling makes no statistical/probabilistic sense whatsoever. Densities are not probabilities. As @Ben says, the area under the curve must be 1 for a density to be a density. The height of this curve is not a probability. The y values of the scaled curve are meaningless. The correct answer is the one below. $\endgroup$ Commented Nov 14, 2023 at 18:57
11
$\begingroup$

It looks like geom_density() is displaying the appropriate values. The area under that whole curve should be 1.

To get an estimate of the probability of certain values, you'd have to integrate over an interval on your 'y' axis, and that value should never be greater than 1.

$\endgroup$
4
  • 1
    $\begingroup$ So, what is currently displayed as the y-axis and how to show the probability? $\endgroup$
    – kodi1911
    Commented Sep 13, 2015 at 15:15
  • 3
    $\begingroup$ Your y-axis is appropriately labeled - it is showing an approximate probability density curve for these data. A density curve can take on point values greater than one, but must be non-negative everywhere and the integral of the whole curve must be equal to one. Check out the Wikipedia article on probability density functions. If you need the y-axis to be less than one, try a histogram with geom_hist(). $\endgroup$
    – user88719
    Commented Sep 13, 2015 at 15:23
  • 1
    $\begingroup$ @DavidKent Using a histogram (the correct geom is named geom_histogram(), BTW) won’t help. A histogram is still a density estimate, and can have y-values greater than 1. $\endgroup$ Commented Sep 13, 2015 at 15:59
  • 1
    $\begingroup$ Ah, that makes sense - it'll still sum to one with aes(y=..density..). Would geom_histogram(aes(y=..count../N)) work? Then the height of each bin would be the proportion of values that are in the bin's range? $\endgroup$
    – user88719
    Commented Sep 13, 2015 at 16:20

Not the answer you're looking for? Browse other questions tagged or ask your own question.