10
$\begingroup$

I have a sample of 1000 data points and I used it as the training sample to forecast with Timeseries. My lecture suggested me comparing the ACF with its critical values (upper and lower) numerically rather than looking at the graph.

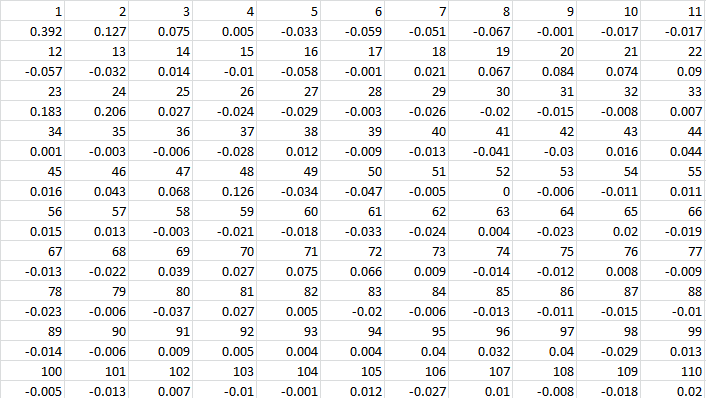
Here are my ACF values:

enter image description here

Question: How do I come up with the upper and the lower critical values for the ACF? Is there any function in R to yield these values?

$\endgroup$
9
  • $\begingroup$ You mean the range()? $\endgroup$
    – user81847
    Commented Dec 7, 2015 at 8:35
  • $\begingroup$ @Pascal No. I mean, how to determine cut off or not by ACF value? $\endgroup$
    – Shieryn
    Commented Dec 7, 2015 at 8:53
  • $\begingroup$ So it is not upper and lower. Please edit. $\endgroup$
    – user81847
    Commented Dec 7, 2015 at 8:54
  • $\begingroup$ @Pascal What is it called? $\endgroup$
    – Shieryn
    Commented Dec 7, 2015 at 8:57
  • 1
    $\begingroup$ Are you looking for critical values for ACF so that you could determine the statistical significance of each lag? Like in a graph, you would have ACF bars and a line representing the 95% critical value; the bars that stick out are statistically significant. $\endgroup$ Commented Dec 7, 2015 at 9:32

2 Answers 2

14
$\begingroup$

Based on this source, it looks like under the null the autocorrelation is asymptoticaly standard normal. The 5% critical values of the autocorrelation at any given lag $d$ ($d \neq 0$) are

$$\pm \frac{1.96}{\sqrt{T-d}}$$

where $T$ is the sample size.

In your case, $T=1000$, so the critical values for lag 1 are $\pm \frac{1.96}{\sqrt{1000-1}} \approx 0.06201$, for lag 2 are $\pm \frac{1.96}{\sqrt{1000-2}} \approx 0.06204$, and so on.

Mind also a note from another source:

Additionally, in small sample conditions ... this test may be overly conservative such that the null hypothesis is rejected (residuals indicated as non-white) less often than indicated by the chosen significance level (Lutkepohl, 2006).

However, it is not likely to be relevant for a sample as large as 1000.


Related question: "How is the confidence interval calculated for the ACF function?".

$\endgroup$
3
  • 1
    $\begingroup$ Is that different critical value between lag 1 , lag 2, lag 3 and further? i thought the critical value in one graph is the same. :D Because in my experience, the graph that i used to make, The line is constant. is there any syntax in R to help me get the critical value? $\endgroup$
    – Shieryn
    Commented Dec 8, 2015 at 1:24
  • $\begingroup$ Yeah, that is a bit puzzling since the line in ACF graphs is typically flat. The critical values are almost the same, at least when the sample size is large and you do not consider very distant lags (just the first few). $\endgroup$ Commented Dec 8, 2015 at 7:43
  • $\begingroup$ How many sample is it that called large? in R, it's flat. which formula to calculate the critical value that flat? how about the PACF? do you have any references? $\endgroup$
    – Shieryn
    Commented Dec 11, 2015 at 9:49
1
$\begingroup$

Since the standard deviation of the acf is approximately = 1/SQRT(NOB) it is so approximate that it is practically useless for large sample sizes . If your "reason" for obtaining critical values is to automatically identify the form of the ARIMA model , you can stop right now ! . Identification of a reasonable starting model for the ARIMA structure is better conducted via approaches like the Inverse Autocorrelation Function http://www.jstor.org/stable/2982488?seq=1#page_scan_tab_contents which is the basis of how AUTOBOX (a piece of software that I have helped develop) effectively solves the riddle.

$\endgroup$
3
  • $\begingroup$ Regarding your first sentence, isn't the approximation working better when the sample size is large than when the sample size is small? I thought it works fine for large samples (e.g. 1000 observations). $\endgroup$ Commented Dec 7, 2015 at 21:37
  • $\begingroup$ I don;t think so after having a long history analyzing simulated data and "obsering/cataloging" over-modelling suggested by this "rule of thumb" . . The larger the number of observations normally leads to "more correct" estimates but not in this case as there is a vast over-statement regarding the possible significance of sample acf's or pacf;s $\endgroup$
    – IrishStat
    Commented Dec 7, 2015 at 21:46
  • 1
    $\begingroup$ There is nonsense and there is nonsense but the most non-sensical thing of all is statistical nonsense ! $\endgroup$
    – IrishStat
    Commented Dec 7, 2015 at 21:50

Your Answer

By clicking “Post Your Answer”, you agree to our terms of service and acknowledge you have read our privacy policy.

Not the answer you're looking for? Browse other questions tagged or ask your own question.