19
$\begingroup$

In explaining why uncorrelated does not imply independent, there are several examples that involve a bunch of random variables, but they all seem so abstract: 1 2 3 4.

This answer seems to make sense. My interpretation: A random variable and its square may be uncorrelated (since apparently lack of correlation is something like linear independence) but they are clearly dependent.

I guess an example would be that (standardised?) height and height$^2$ might be uncorrelated but dependent, but I don't see why anyone would want to compare height and height$^2$.

For the purpose of giving intuition to a beginner in elementary probability theory or similar purposes, what are some real-life examples of uncorrelated but dependent random variables?

$\endgroup$
7
  • 1
    $\begingroup$ This doesn't answer your question, but seems relevant: Sometimes a rv and its square are correlated and sometimes uncorrelated. For example, if X is uniform on [0,1], then X and X^2 are uncorrelated. But if X is uniform on [-1, 1], then X and X^2 are uncorrelated. (Draw a picture to help see this.) However, in both cases, X and X^2 are dependent. $\endgroup$
    – Martha
    Commented Dec 26, 2015 at 5:39
  • 1
    $\begingroup$ @Martha there's a typo in your comment. I think it's the first 'uncorrelated' that should be 'correlated'. ;) $\endgroup$ Commented Dec 26, 2015 at 11:50
  • 1
    $\begingroup$ @BCLC "if X is uniform on [0,1], then X and X^2 are uncorrelated." Should be "if X is uniform on [0,1], then X and X^2 are correlated.", I think. $\endgroup$ Commented Dec 26, 2015 at 12:25
  • 1
    $\begingroup$ @Anoldmaninthesea You are correct: Correlated on [0,1], but uncorrelated on [-1,1]. Thanks for pointing out the typo. $\endgroup$
    – Martha
    Commented Dec 27, 2015 at 20:44
  • 1
    $\begingroup$ When we say that two random variables are correlated we implicitly mean linearly correlated. But a dependency might be more complicated than that. $\endgroup$ Commented Dec 31, 2015 at 1:03

4 Answers 4

18
$\begingroup$

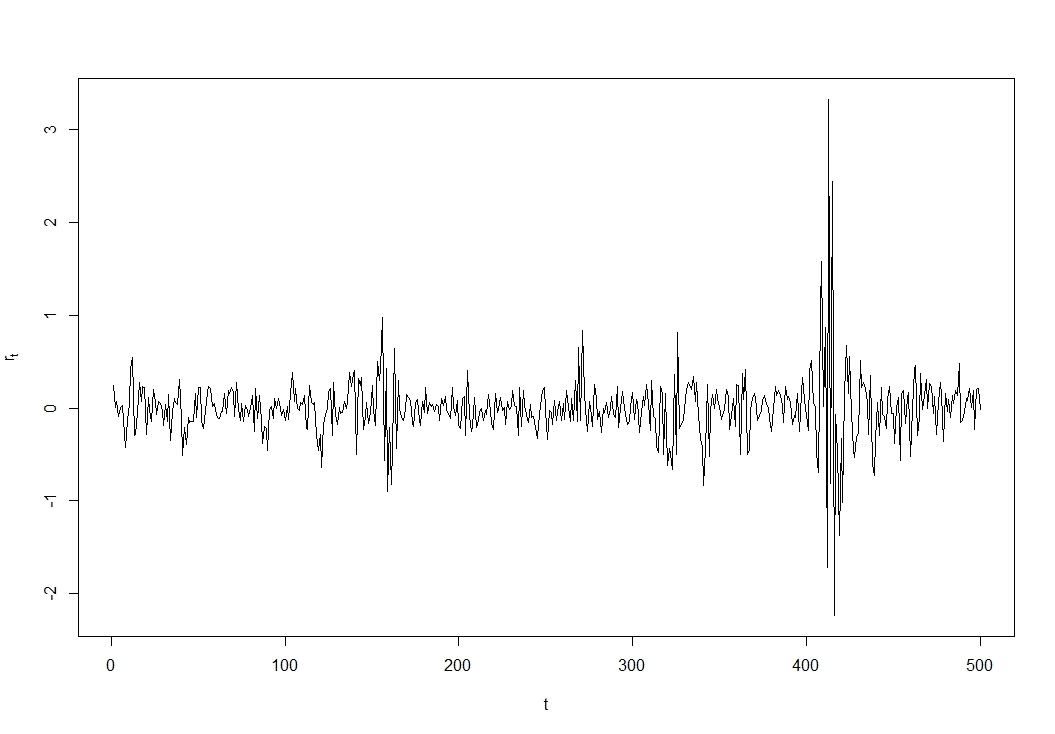
In finance, GARCH (generalized autoregressive conditional heteroskedasticity) effects are widely cited here: stock returns $r_t:=(P_t-P_{t-1})/P_{t-1}$, with $P_t$ the price at time $t$, themselves are uncorrelated with their own past $r_{t-1}$ if stock markets are efficient (else, you could easily and profitably predict where prices are going), but their squares $r_t^2$ and $r_{t-1}^2$ are not: there is time dependence in the variances, which cluster in time, with periods of high variance in volatile times.

Here is an artificial example (yet again, I know, but "real" stock return series may well look similar):

enter image description here

You see the high volatility cluster around in particular $t\approx400$.

Generated using R code:

library(TSA)
garch01.sim <- garch.sim(alpha=c(.01,.55),beta=0.4,n=500)
plot(garch01.sim, type='l', ylab=expression(r[t]),xlab='t')
$\endgroup$
0
7
$\begingroup$

A simple example is a bivariate distribution that is uniform on a doughnut-shaped area. The variables are uncorrelated, but clearly dependent - for example, if you know one variable is near its mean, then the other must be distant from its mean.

$\endgroup$
4
  • $\begingroup$ What exactly are the two variables? $\endgroup$
    – BCLC
    Commented Dec 27, 2015 at 0:42
  • $\begingroup$ The two random variables $X$ and $Y$ whose joint distribution is uniform on the doughnut. For a specific example, consider the joint density $f(x,y) = 1 / 3\pi$ when $1 < x^2+y^2 < 2$ and $0$ otherwise. $\endgroup$
    – Russ Lenth
    Commented Dec 27, 2015 at 0:55
  • $\begingroup$ Well I guess physics examples are real life. Thanks rvl. Why is your example true? $\endgroup$
    – BCLC
    Commented Dec 27, 2015 at 2:43
  • 4
    $\begingroup$ Draw a graph of the region where the density is nonzero and think about it. $\endgroup$
    – Russ Lenth
    Commented Dec 27, 2015 at 3:18
6
$\begingroup$

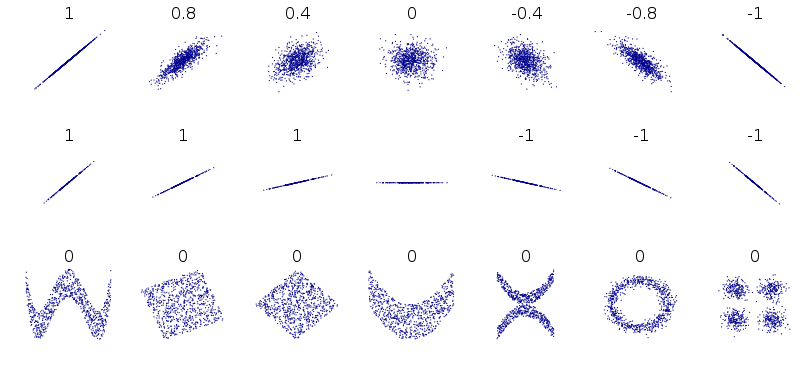
I found the following figure from wiki is very useful for intuition. In particular, the bottom row show examples of uncorrelated but dependent distributions.

enter image description here

Caption of the above plot in wiki: Several sets of (x, y) points, with the Pearson correlation coefficient of x and y for each set. Note that the correlation reflects the noisiness and direction of a linear relationship (top row), but not the slope of that relationship (middle), nor many aspects of nonlinear relationships (bottom). N.B.: the figure in the center has a slope of 0 but in that case the correlation coefficient is undefined because the variance of Y is zero.

$\endgroup$
0
2
$\begingroup$

There are two words that you mention in the title of your question that are usually used interchangeably, correlation and dependence, but in the body of your question you restrict the definition of correlation to Pearson correlation, which in my opinion is indeed the appropriate meaning to correlation, when no other detail is provided. However, I believe that what you really want to ask goes beyond linear correlation, towards statistical dependence, that is: When are variables dependent, but independent when measured?

I mean, it's straightforward that a measure of linear association won't catch an association between variables that are associated but not in a linear way. Examples of that are all around us, though a r value of exactly 0 can be hard to find.

However, going back to the broader question that I elaborated, there could be spurious independence. That is, the variables are dependent, but your sampling will suggest that they are independent. I wrote an article about this, and there are scientific papers mentioning this problem too, such as this one.

Controlling for variables can be equivalent to slicing your data. By slicing too much (adjusting for many other variables), it's expected for your two random variables to appear independent. One may say: But I am not adjusting for anything! And the answer is: You don't need to. The collected data may be biased (selection bias) and you're not aware of it.

$\endgroup$
8
  • $\begingroup$ Thanks mribeirodantas 1 - What exactly is correlation that isn't Pearson correlation? Or... do you mean to generalise that there's some measure of independence higher than linear independence but lower than full independence? 2 - what do you mean by 'independent when measured' ? $\endgroup$
    – BCLC
    Commented May 6, 2022 at 2:51
  • 1
    $\begingroup$ 1 - There are many correlation measures that are not Pearson's correlation. There is Kendall rank correlation or Spearman's rank-order correlation. With the broader definition of correlation, there are numerous other techniques such as mutual information, Matthew's correlation coefficient, Maximal information coefficient and so on. 2 - Even though you know that A and B are correlated in a population, you could sample this population in a way that A and B will not correlate in individuals in your sampling. Feel free to ask a new questions. Comments can be hard to go into much detail. $\endgroup$ Commented May 6, 2022 at 15:37
  • $\begingroup$ 1 - OH yeah kendall tau spearman rho riiiiiiiiight. 'If the variables are independent, Pearson's correlation coefficient is 0, but the converse is not true because' aaaaahhhhh so when we say independent implies uncorrelated...what we mean is pearson-uncorrelated? (1.1 - but probably independent implies uncorrelated in every other sense ?) 2 - ok ok you said what I wanted to ask is like 'When are variables dependent, but independent when measured?' ummmm why? Also please dumb it down. This just for elem prob/stat where we think 'independent implies uncorrelated'. My point of this question (...) $\endgroup$
    – BCLC
    Commented May 6, 2022 at 16:39
  • $\begingroup$ (...) is those lame examples like $X$ and $X^2$. Like who cares about comparing $X$ and $X^2$ ? Even all the examples here are hard (or at least I'm not familiar with them). In Christoph Hanck's answer...ok fine I did learn GARCH in bachelor's or master's (I think master's) but never minding that I've got some real uncorrelated X and Y that when squared are not uncorrelated. So ok you can generalise but what's your example for this? Make an intuitive real life example please. You can use finance, economics, physics, etc. $\endgroup$
    – BCLC
    Commented May 6, 2022 at 16:44
  • $\begingroup$ Or hell biology like if there's like height vs weight and then height$^2$ vs weight$^2$ $\endgroup$
    – BCLC
    Commented May 6, 2022 at 16:44

Your Answer

By clicking “Post Your Answer”, you agree to our terms of service and acknowledge you have read our privacy policy.

Not the answer you're looking for? Browse other questions tagged or ask your own question.