1
$\begingroup$

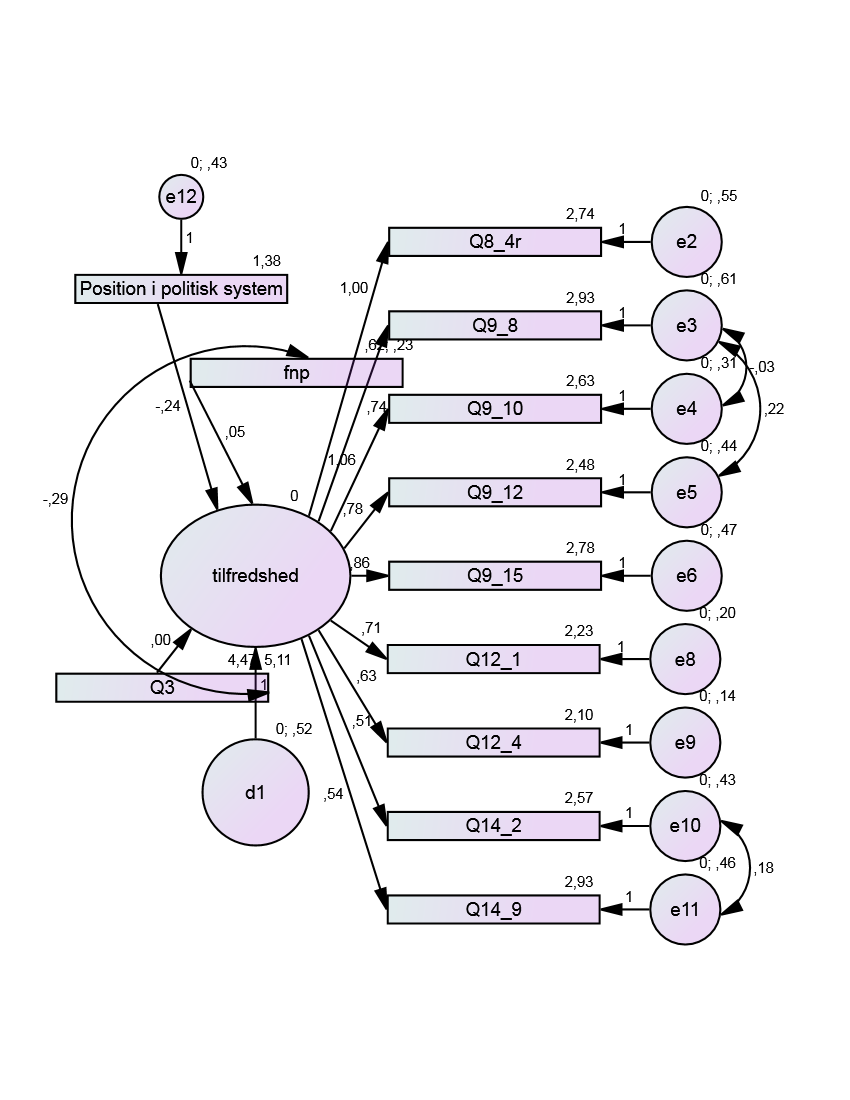
I am currently doing some research and encountered this issue in one my SEM-analysis. The full SEM model has a very high explained variance (Squared Multiple Correlations) for the explained latent variable.

Here is the full SEM model:

http://1drv.ms/1oPm41w

The output is here: (pdf).

The model fit is not exactly great, hence I wonder what possible explanation there could be for the high explained variance. My current idea is that some of the latent indicators have cross loadings on the indicators, but otherwise I am stumped!

$\endgroup$
3
  • $\begingroup$ Why does e12 exist? That variable is exogenous. Why is position not correlated with Q3 and FNP? $\endgroup$ Commented Feb 29, 2016 at 15:01
  • $\begingroup$ Your path diagram would be much easier to read if it was tidied up a bit. Move the arrow on Q3 to the left of the box. Move fnp lift so its correlation doesn't cross anything else. Put the regression from fnp to tilf in the middle. $\endgroup$ Commented Feb 29, 2016 at 15:02
  • $\begingroup$ I've removed the amos and spss tags, as these are not relevant. $\endgroup$ Commented Feb 29, 2016 at 15:03

1 Answer 1

1
$\begingroup$

The short answer is that your model doesn't fit. If the model doesn't fit, your parameter estimates are not trustworthy. If your parameter estimates aren't trustworthy, don't worry about why they are so high or so low. They're wrong.

The parameter estimates can give you clues about the why there is lack of fit.

$\endgroup$

Your Answer

By clicking “Post Your Answer”, you agree to our terms of service and acknowledge you have read our privacy policy.

Not the answer you're looking for? Browse other questions tagged or ask your own question.