3
$\begingroup$

I am currently making a short literature study of robust and efficient estimators. Some very well known are the median absolute deviation (MAD) and the interquartile range (IQR). However they both have a weakness for non-normal distributions, with the five number summary having at least the advantage of showing skewness through the box and whiskers plot.

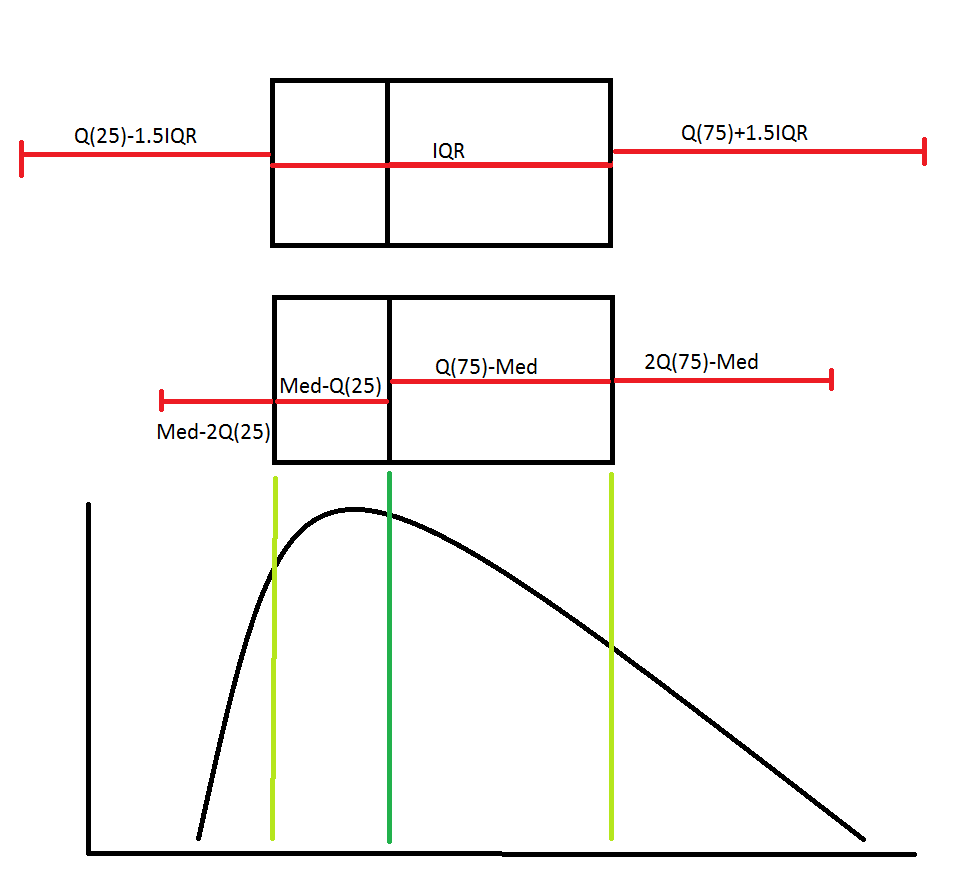
To me, it seems unreasonable to use the IQR, because it assumes same spacing both to the right and to the left of the corresponding quartile. In a distribution like the one shown below, this would cause a lot of "useless" information still to be included. (See Fig below, first box and whiskers plot)

What I would like to propose instead is to use the distance from the lower quartile to the median as an estimator for the standard deviation for values lower than the median, and the opposite for values higher than the median: $$ \text{if } x<\text{Med:} \ \text{reject if }|x−3(\text{Med}−Q(0.25))|>0 \\ \text{if } x>\text{Med:} \ \text{reject if } |x−3(Q(0.75)−\text{Med})|>0 $$ Of course, this method is quite robust (25%) and incredibly easy/fast to calculate. It would also follow the nature of the data when rejecting outliers.

What I would like to ask is if anybody else has seen this method applied somewhere else? It would also be great if somebody can help me find a way to calculate the efficiency of this method and/or mention its advantages/disadvantages.

Here a picture of what I am trying to say (only a spread of 2 s.d. are used in this case, to compare with the IQR it would be 3 s.d.): enter image description here
$\endgroup$
13
  • 3
    $\begingroup$ "the IQR having at least the advantage of showing the skewedness through the box and whiskers plot" - I'm not sure I follow this. On its own, the IQR is only a measure of dispersion, not of skewness. $\endgroup$
    – Silverfish
    Commented Mar 1, 2016 at 11:19
  • 7
    $\begingroup$ The IQR is just what it is defined to be; there is no assumption of symmetry; equally nothing means that it can be interpreted easily without looking at median and quartiles. You might as well say that the SD assumes symmetry around the mean; not so, and nothing stops that being useful for distributions that are right-skewed, e.g. exponentials and Poissons. $\endgroup$
    – Nick Cox
    Commented Mar 1, 2016 at 11:50
  • 4
    $\begingroup$ It is quite fallacious to suppose that symmetry of the quartiles around the median requires normality. That would be true e.g. of logistic and t distributions. You could even construct distributions with quartiles equally distant from the median but asymmetric overall. $\endgroup$
    – Nick Cox
    Commented Mar 1, 2016 at 11:51
  • 1
    $\begingroup$ I have added an image to what I meant. Maybe that helps? $\endgroup$
    – Nenunathel
    Commented Mar 1, 2016 at 14:14
  • 2
    $\begingroup$ All summary statistics by their very nature discard some information from the sample, so you will always find such limitations. If you want to know something about the skewness then do not look at the IQR, look at the skewness. The IQR is intended as a robust measure of dispersion and is a fairly concise way of summarizing this information. $\endgroup$
    – dsaxton
    Commented Mar 1, 2016 at 14:15

0