3
$\begingroup$

Assuming I have the following model:

$$ y(t) = \alpha {e}^{- \beta t} + \gamma + n(t) $$ Where $ n(t) $ is additive white Gaussian noise (AWGN) and $ \alpha, \beta, \gamma $ are the unknown parameters to be estimated.

In this case linearization using the logarithm function won't help.

What could I do? What would be the ML Estimator / LS Method? Is there a special treatment to non positive data points?

How about the following model:

$$ y(t) = \alpha {e}^{- \beta t} + n(t) $$

In this case, it would be helpful to use the logarithm function, yet, I could I handle the non positive data?

Thanks.

$\endgroup$
4
  • 1
    $\begingroup$ It helps to define initialisms like AWGN (additive white Gaussian noise, I presume) upon first use, as they tend to be particular to certain fields or subfields. $\endgroup$
    – cardinal
    Commented Dec 27, 2011 at 13:00
  • $\begingroup$ Have you looked in, e.g., the classical Seber & Wild? $\endgroup$
    – cardinal
    Commented Dec 27, 2011 at 13:01
  • $\begingroup$ Some general discussion of models like these appears at stats.stackexchange.com/questions/6720/…. $\endgroup$
    – whuber
    Commented Dec 27, 2011 at 15:23
  • $\begingroup$ @cardinal, I will look into the book. Could you point me specifically to this problem? Thanks. $\endgroup$
    – Royi
    Commented Dec 28, 2011 at 9:34

1 Answer 1

4
$\begingroup$

I don’t really get what you mean with AGWN, is this simply that $n(t_i)$ are independent with $n(t_i) \sim N(0,\sigma^2)$?

The least squares estimator (which, as usual with a normal model, coincide with maximum likelihood estimator, see eg this answer) is easy to find with numerical methods, here is a piece of R code:

a <- 2; b <- 0.2; c <- -1
t <- seq(-5,10, length=100)
y <- a*exp(-b*t)+c+rnorm(length(t), sd=2)
f <- function(par, t, y) { 
  a <- par[1]; b <- par[2]; c <- par[3]; 
  return(sum((a*exp(-b*t)+c-y)**2 ) ); }
nlm( function(par) f(par, t, y), c(0,0,0))

The result of the last call is

$minimum
[1] 430.8242

$estimate
[1]  2.0875336  0.1961210 -0.8672079

$gradient
[1]  1.301591e-05 -2.745537e-05  2.603429e-05

$code
[1] 1

$iterations
[1] 19

Our initial values (2, 0.2, -1) are estimated by (2.088, 0.196, -0.867). You can get a plot of the data points, the "true model" (red line) and the estimated model (dotted red line) as follows:

plot(t,y)
lines( t, a*exp(-b*t)+c, col="red")
nlm( function(par) f(par, t, y), c(0,0,0))$estimate -> r
lines( t, r[1]*exp(-r[2]*t)+r[3], col="red", lty=2)
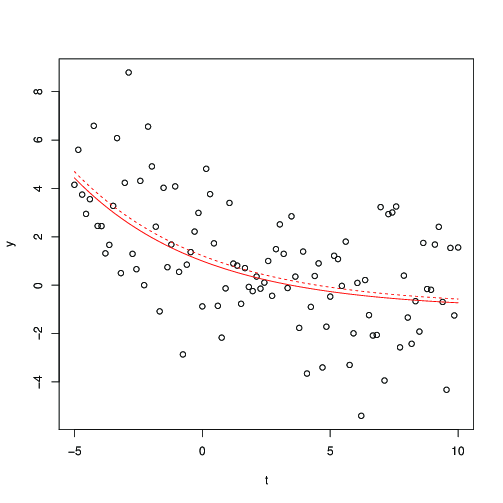
Data points, with in red line the true model, in dotted red line the fitted model

Also, be sure not to miss this related question already quoted by whuber in the comments.

A few hints for numerical optimization

In the above code the numerical optimization is done using nlm, a function of R. Here are a few hints for a more elementary solution.

If $b\ne 0$ is fixed, it is easy to find $a$ and $c$ minimizing $f(a,b,c) = \sum_{i=1}^n (a \exp(-b\cdot t_i) +c -y_i)^2$: this a the classical least squares for the linear model. Namely, letting $x_i = \exp(-b\cdot t_i)$, we find $$ \begin{array}{rcccl} a &=& a(b) &=& { n \sum_i y_i x_i - \left( \sum_i y_i \right)\left(\sum_i x_i \right)\over n \sum x_i^2 - \left(\sum_i x_i \right)^2 }, \\ c &=& c(b) &=& { \sum_i y_i \sum_i x_i^2 - \left( \sum_i y_i x_i \right)\left(\sum_i x_i \right)\over n \sum x_i^2 - \left(\sum_i x_i \right)^2 }. \\ \end{array}$$

Then set $$ g(b) = f(a(b), b, c(b)).$$ The optimization problem is now reduced to find the minimum of $g(b)$. This can be done either using Newton method or a ternary search.

$\endgroup$
14
  • $\begingroup$ +1 It would help to explain why this really is a least squares problem. $\endgroup$
    – whuber
    Commented Dec 27, 2011 at 15:23
  • $\begingroup$ @whuber I don’t get it, do you mean "why the MLE and the LSE coincide"? $\endgroup$
    – Elvis
    Commented Dec 27, 2011 at 15:30
  • $\begingroup$ Yes: the steps implicit in your answer are that (a) you propose using ML and (b) the MLE is the least squares solution. With your experience, these are natural and perhaps seem obvious, but other readers might not make the connections. $\endgroup$
    – whuber
    Commented Dec 27, 2011 at 16:28
  • 1
    $\begingroup$ You’re right @whuber and this is not so obvious, just "usual". I has the feeling that the OP was familiar with this, I added a link to a very similar question, I hope this is enough — if you think that it would be better to rewrite it in this special case let me know. $\endgroup$
    – Elvis
    Commented Dec 27, 2011 at 17:43
  • $\begingroup$ @ElvisJaggerAbdul-Jabbar, Thank you. Could you explain the algorithm as I'm not familiar with 'R'. How could you handle "Negative" samples and the constant. $\endgroup$
    – Royi
    Commented Dec 28, 2011 at 9:26

Your Answer

By clicking “Post Your Answer”, you agree to our terms of service and acknowledge you have read our privacy policy.

Not the answer you're looking for? Browse other questions tagged or ask your own question.