2
$\begingroup$

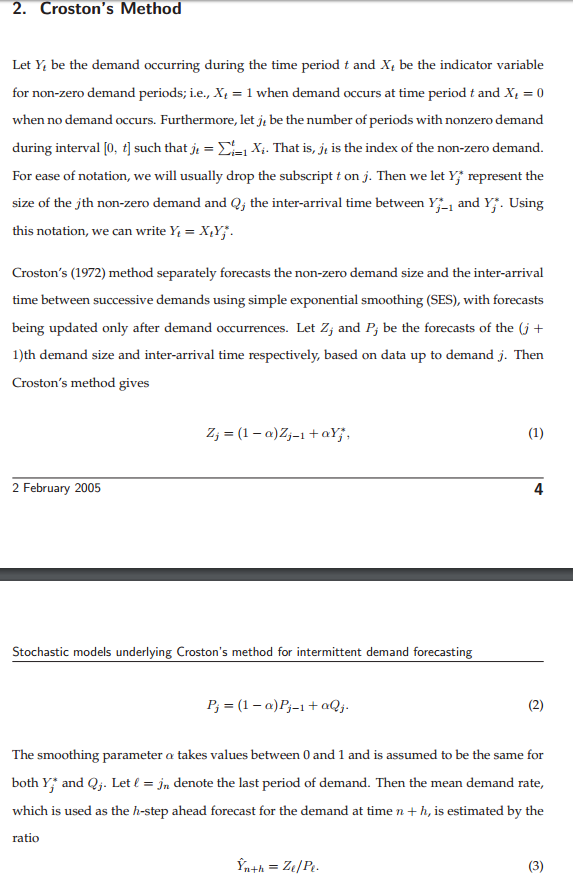
I found some literature that explained the Croston's method I'm trying to implement for forecasting. The source explains the method like the picture below.


The way I understand this, you could see two sets of data, one indexed by $t$, and one indexed by $j_t$, the one of $t$ containing data of which $Y_t=0\space or \space Y_t<>0$ and the one of $j_t$ only containing values where $Y_t<>0$.

It is explained that the model doesn't when there are 'zero' values. This brings me the following question:

How is it possible that when you have ten datapoints, with $Y_1=0$, $Y_2=1$, and $Y_t=0 \space for \space t=3,...,10$, that the forecast for $t=11$ will be $0.5$? What am I doing wrong? Why shouldn't I adjust the forecasts for interval and demand size for the zero values?


Hyndman explanation for Croston's method

$\endgroup$

1 Answer 1

3
$\begingroup$

OK, let's use your data: $y_1=0, y_2=1, y_3=\dots=y_{10}=0$.

The problem is that Croston's method only updates its state variables whenever there is a nonzero demand. In our case:

  • The inter-arrival time state is initialized as $P_1=2$, because the first nonzero demand occurred in the second time period. After that, it is not updated, because there is no other nonzero demand.
  • The demand size state is initialized as $Q_1=1$, because the first nonzero demand was of size 1. After that, it is not updated, because there is no other nonzero demand.

The point forecast right after this initialization in period 2 would therefore be $Q_1/P_1=0.5$. And since nothing is updated as long as there is no new nonzero demand, the point forecast stays at this value until a new demand occurs.

Now, one might of course object that this makes no sense and that (say) we would want the inter-arrival time state to be updated more often, say after every time period. However, this runs into the problem that your forecast will be too high right after a nonzero demand, and too low after many nonzero demands. This is essentially the same problem as you see if you apply Single Exponential Smoothing to intermittent demands.


In our example, we only observed ten data points. Croston's method is designed to catch changes in the dynamics of the intermittent time series we are looking at. Question: will we even be able to detect changing dynamics in a time series that is (a) very short and (b) carries very little signal? I'd say no.

So my recommendation would be: think about the length of the time series you have, and about the specific things whose demand you are forecasting. If your series are so short that you likely won't be able to detect changes in dynamics, don't use Croston's method. Instead, use a simple arithmetical average of past sales, which would in this case give you a forecast of $1/10$.

Here are a few earlier thoughts of mine on intermittent and count data forecasting.

$\endgroup$
4
  • $\begingroup$ This is pretty clear, thanks. What length of time series data would you say is recommended for the Croston's method? I currently have 15 months of monthly data, so I see that isn't enough. Otherwise I guess I'll stick to the average. $\endgroup$
    – Grafit
    Commented Apr 5, 2016 at 8:44
  • 1
    $\begingroup$ 15 months is really not a lot. I wouldn't expect Croston to be helpful for less than three years of monthly data. I'd recommend you simulate some data, make assumptions about changing dynamics and see whether Croston's or another method yields better forecasts. (Check my earlier answer about not evaluating an intermittent demand forecast using MAD/MAE.) $\endgroup$ Commented Apr 5, 2016 at 8:58
  • $\begingroup$ Another question in this matter. I assumed you can also get the count data of the current month and add it to the data of the last month, for the month after that add the data to the two months before (so you get a cumulative). Do I assume this right, and if I do, is it right to do a linear regression forecast and measure the accuracy of that forecast with rRMSE as well? $\endgroup$
    – Grafit
    Commented Apr 5, 2016 at 13:10
  • 1
    $\begingroup$ You can do that. The question is whether this cumulative forecast is useful in whatever subsequent decisions or processes you will use your forecast in, or whether you need to de-cumulate it again. In this case, a highly accurate cumulative forecast may be useless. $\endgroup$ Commented Apr 5, 2016 at 13:19

Your Answer

By clicking “Post Your Answer”, you agree to our terms of service and acknowledge you have read our privacy policy.

Not the answer you're looking for? Browse other questions tagged or ask your own question.