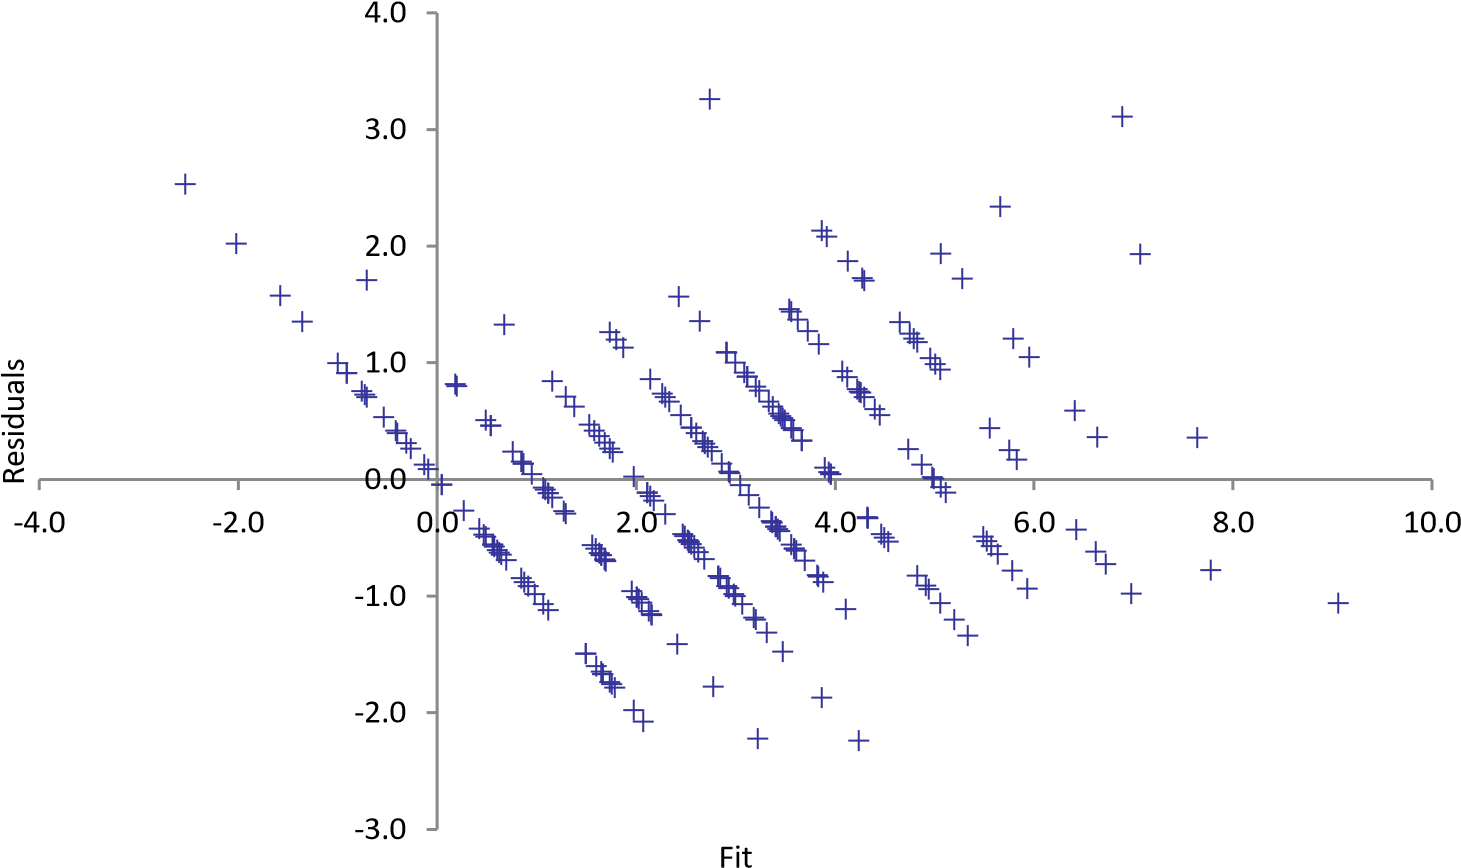
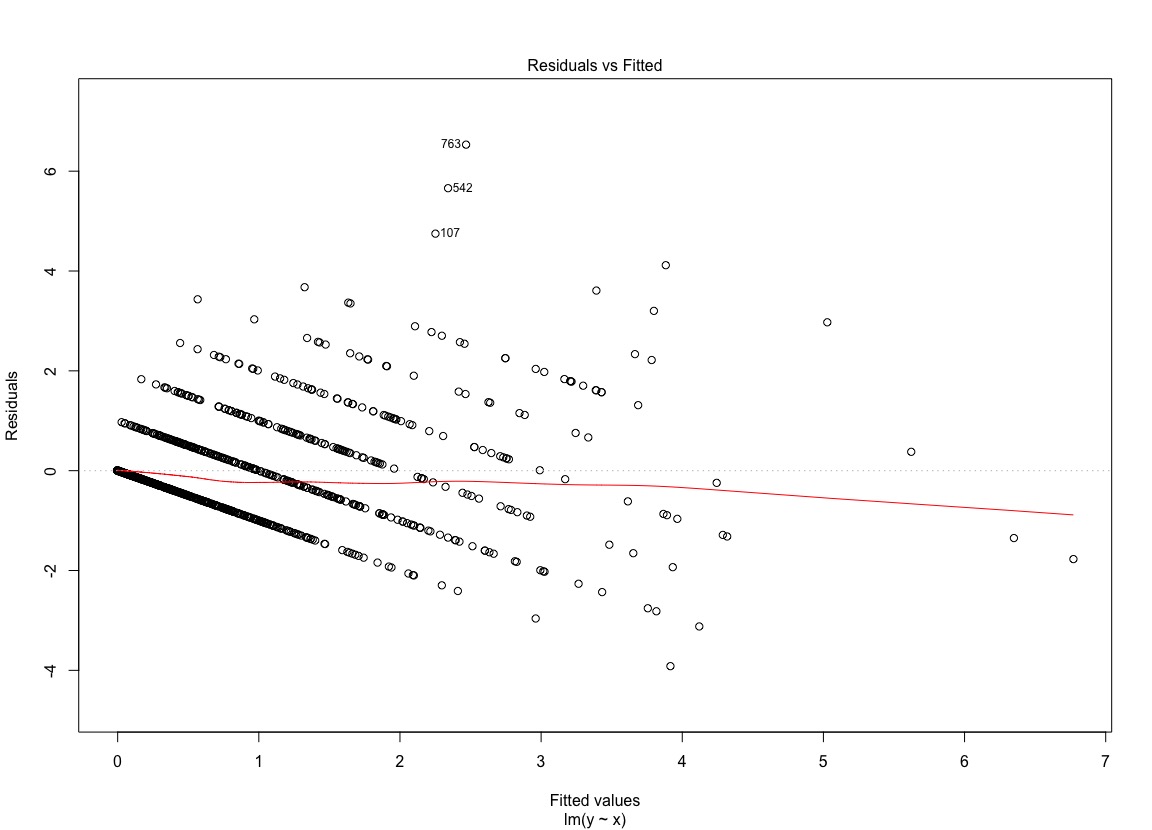
Can anyone advise how to interpret this resulting residuals vs fitted graph and what may be wrong with the model?
$\begingroup$
$\endgroup$
2
-
6$\begingroup$ Searching for "diagonal" and "residual" gives several other posts on this site for this phenomenon: in ANOVA, in Poisson regression and in multiple regression. I think yours is really a duplicate of the latter, though I like how clearly your graphs show the phenomenon! $\endgroup$– SilverfishCommented Sep 17, 2016 at 11:59
-
$\begingroup$ Not the answer, but always prefer software in which the axis labels can be lifted to the periphery, leaving just the axes themselves. $\endgroup$– Nick CoxCommented Sep 17, 2016 at 14:00
Add a comment
|
1 Answer
$\begingroup$
$\endgroup$
This is a well known phenomenon of regressing integer valued outcomes on a continuous predictor. Aside from that, there is surprisingly little that can be revealed from any "interpretation" of this residual plot.
Example:
> x <- rexp(1000)
> y <- rpois(1000, x)
> plot(y ~ x)


