I am in the process of brushing up on my skills about time series data. So I first started with doing a Dickey Fuller test in excel to test for stationary of some data series. I was using the example found on this page .
My hypothesis tests are as follows:
$ H_o: B=0$ Is there a unit root?
$H_a: B<0$ The data is stationary and no unit root exists.
I want to reject the null and essentially accept the alternative.
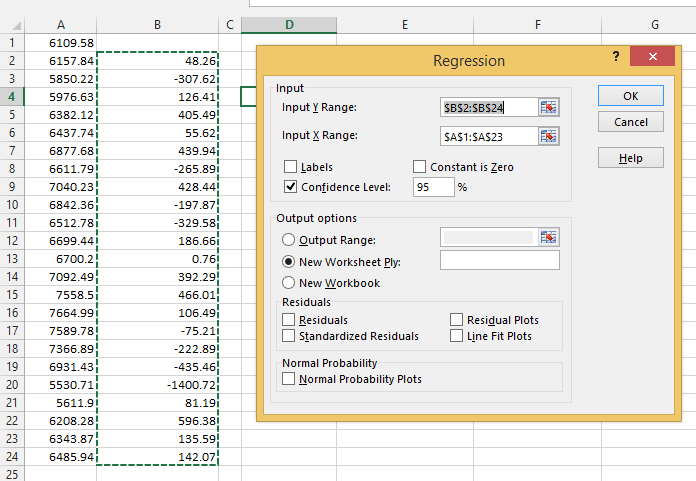
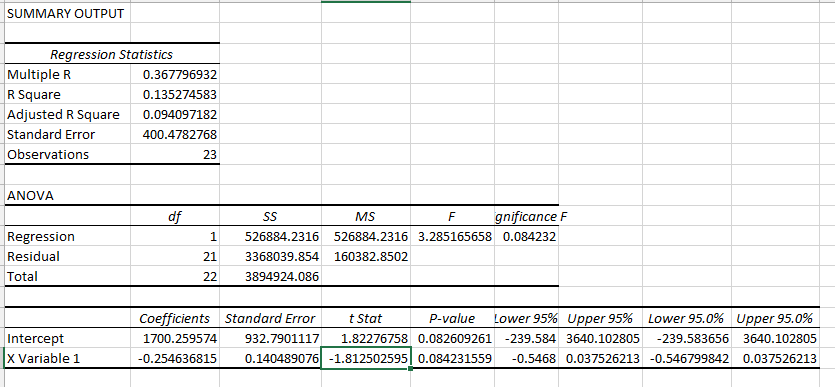
So ran it and low and behold our answers differ in sign, theirs are positive and mine are negative. Here are some photos of what I entered into excel.


So now, let's assume I am right with what I did because I can't figure out how I could be wrong for now, hence the question. In testing the t-stat -1.812 is greater than -2.63 at the 10% level(using 10% based on their example).
Can I also get some help on testing t-values.
Data (use text to columns and then a space as the separator)
6109.58
6157.84 48.26
5850.22 -307.62
5976.63 126.41
6382.12 405.49
6437.74 55.62
6877.68 439.94
6611.79 -265.89
7040.23 428.44
6842.36 -197.87
6512.78 -329.58
6699.44 186.66
6700.2 0.76
7092.49 392.29
7558.5 466.01
7664.99 106.49
7589.78 -75.21
7366.89 -222.89
6931.43 -435.46
5530.71 -1400.72
5611.9 81.19
6208.28 596.38
6343.87 135.59
6485.94 142.07
