3
$\begingroup$

I ran a polynomial regression in R and Excel and have gotten different coefficients, despite the fitted plots being the same. I wonder why.

Here's the R code with data, coefficients and plot: x <- c(1,2,3,4,5,6,7,8,9,10,11,12,13,14,15,16,17,18,19,20,21,22,23,24,25, 26,27,28,29,30,31,32,33,34,35,36,37,38,39,40,41,42,43,44,45,46,47,48, 49,50,51,52,53,54,55,56,57,58,59,60,61,62,63,64,65,66,67,68,69,70,71,72, 73,74,75,76,77,78,79,80,81,82,83,84,85,86,87,88,89,90,91,92,93,94,95,96, 97,98,99,100) y <- c(99,32,59,50,77,58,8,81,67,12,79,9,94,14,7,23,37,67,65,84,18,99,11, 12,21,19,4,80,42,53,100,52,4,60,17,2,60,10,0,54,62,22,93,4,90,56,44,41,97,89, 46,14,5,39,64,13,86,84,88,82,25,31,13,74,5,84,74,16,23,15,12,4,89,79,89, 73,50,65,0,19,20,63,63,84,66,27,100,52,30,49,92,77,92,45,30,47,95, 93,52,6) poly.model <- lm(y ~ poly(x, 5)) plot(x, y, main = "R output") lines(x, fitted(poly.model), col = "black", lwd = 1, lty = 1) # The command poly.model$coefficients will give following coefficients # Intercept 1 2 3 4 5 # 48.82 31.99951 41.07092 -25.61735 20.797 -30.48938 R-output
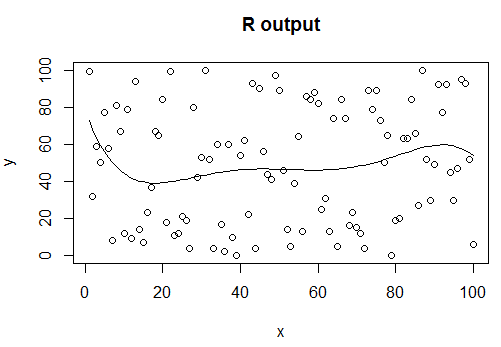
Here is the Excel screenshot with coefficients from trend line. Excel-output
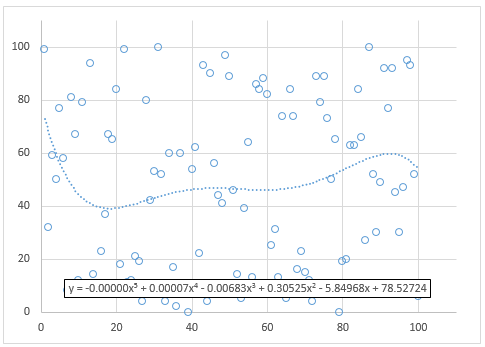
You can see the coefficients are vastly different. Can you please help me understand why? Thank you.

$\endgroup$
5
  • $\begingroup$ Bad numerical methods in excel? $\endgroup$ Commented Jan 21, 2017 at 5:26
  • $\begingroup$ Sorry? The Excel intercept of 78 looks much closer based on both charts than what R is saying - 48. Unless I'm missing a point ... $\endgroup$
    – PBD10017
    Commented Jan 21, 2017 at 5:28
  • $\begingroup$ I'd like to add, that since R can plot the "fitted" line correctly, I assume it's something I don't understand about their coefficients. $\endgroup$
    – PBD10017
    Commented Jan 21, 2017 at 5:28
  • $\begingroup$ did you happen to find out which orthogonal polynomials R uses? $\endgroup$ Commented Dec 4, 2017 at 17:01
  • $\begingroup$ No, I wasn’t looking into it past Antoni’s answer. “Raw = T” fixed the issue. I suppose you could deduce from there. Possibly using Antoni’s link below. $\endgroup$
    – PBD10017
    Commented Dec 4, 2017 at 19:40

2 Answers 2

9
$\begingroup$

Try

poly.model <- lm(y ~ poly(x, 5 , raw = TRUE))

Call:
lm(formula = y ~ poly(x, 5, raw = T))

Coefficients:
         (Intercept)  poly(x, 5, raw = T)1  
           7.853e+01            -5.850e+00  
poly(x, 5, raw = T)2  poly(x, 5, raw = T)3  
           3.053e-01            -6.827e-03  
poly(x, 5, raw = T)4  poly(x, 5, raw = T)5  
           6.890e-05            -2.555e-07 

poly {stats} raw if true, use raw and not orthogonal polynomials.

The orthogonal polynomial is summarized by the coefficients, which can be used to evaluate it via the three-term recursion given in Kennedy & Gentle (1980, pp. 343–4), and used in the predict part of the code.


Here is a good reference post.

$\endgroup$
1
4
$\begingroup$

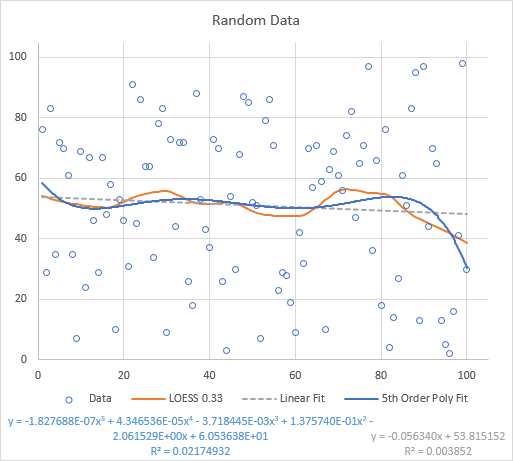
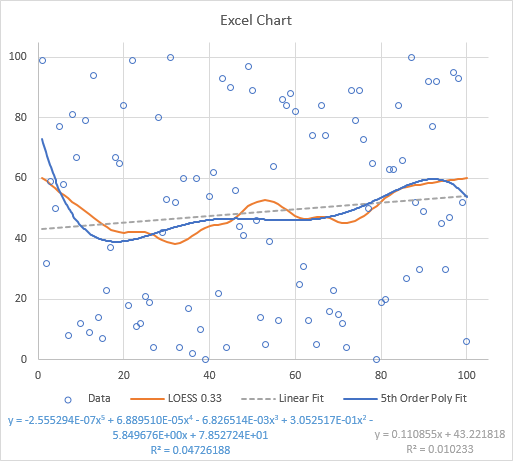
I have to wonder what use is it to try to fit this data. In the chart below I have added a linear fit (R² of 0.010), a 5th order poly fit (R² of 0.047), and a LOESS fit with alpha = 0.33. None fit the data very closely, and the difference in the wiggles of the poly and LOESS fits don't seem to improve on the linear fit.

100 Points Fitted

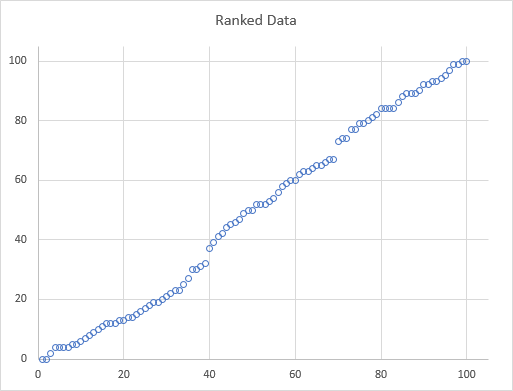
In fact, if I rank your points, it looks like they are randomly and uniformly distributed between 0 and 100.

100 Points Ranked

If I replace your 100 points with 100 randomly generated whole numbers between 0 and 100, I get another plot which is not qualitatively different than the original.

100 Random Points

$\endgroup$
2
  • $\begingroup$ Jon - I used fake data. To do it fast I did rand(0, 100) as you've seen. It's not about the fit. It was about the difference between coefficients. I wasn't aware of the orthogonal coefficients and "raw=T" fixed it. $\endgroup$
    – PBD10017
    Commented Jan 28, 2017 at 16:13
  • $\begingroup$ Ha ha, explains why my random numbers looked as good as yours. The thing is, I've seen so many instances where people have data not unlike this, and they thing a high-order polynomial fit makes sense. I'm glad the other answer helped you. $\endgroup$ Commented Jan 29, 2017 at 19:13

Your Answer

By clicking “Post Your Answer”, you agree to our terms of service and acknowledge you have read our privacy policy.

Not the answer you're looking for? Browse other questions tagged or ask your own question.