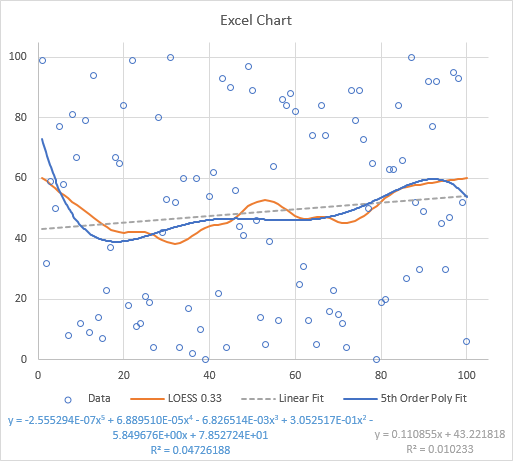
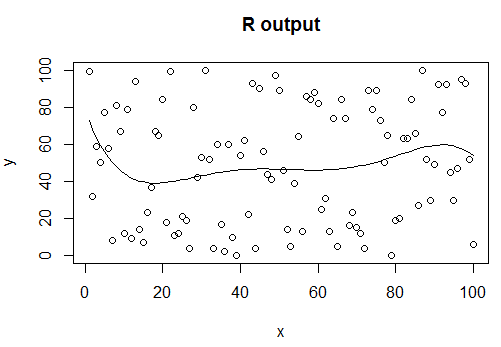
I ran a polynomial regression in R and Excel and have gotten different coefficients, despite the fitted plots being the same. I wonder why.
Here's the R code with data, coefficients and plot:
    x <- c(1,2,3,4,5,6,7,8,9,10,11,12,13,14,15,16,17,18,19,20,21,22,23,24,25,
    26,27,28,29,30,31,32,33,34,35,36,37,38,39,40,41,42,43,44,45,46,47,48,
    49,50,51,52,53,54,55,56,57,58,59,60,61,62,63,64,65,66,67,68,69,70,71,72,
    73,74,75,76,77,78,79,80,81,82,83,84,85,86,87,88,89,90,91,92,93,94,95,96,
    97,98,99,100)
    y <- c(99,32,59,50,77,58,8,81,67,12,79,9,94,14,7,23,37,67,65,84,18,99,11,
   12,21,19,4,80,42,53,100,52,4,60,17,2,60,10,0,54,62,22,93,4,90,56,44,41,97,89,
   46,14,5,39,64,13,86,84,88,82,25,31,13,74,5,84,74,16,23,15,12,4,89,79,89,
   73,50,65,0,19,20,63,63,84,66,27,100,52,30,49,92,77,92,45,30,47,95,
   93,52,6)
   poly.model <- lm(y ~ poly(x, 5))
   plot(x, y, main = "R output")
   lines(x, fitted(poly.model), col = "black", lwd = 1, lty = 1)
   # The command poly.model$coefficients will give following coefficients
   # Intercept 1         2         3           4       5
   # 48.82     31.99951  41.07092  -25.61735   20.797  -30.48938
Here is the Excel screenshot with coefficients from trend line.
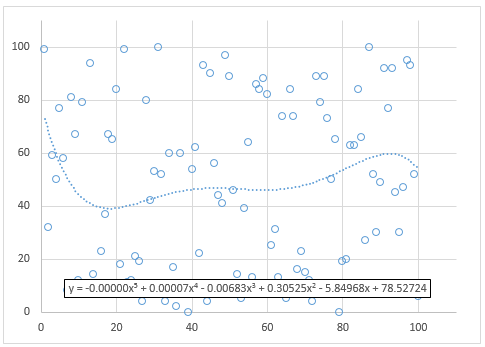
You can see the coefficients are vastly different. Can you please help me understand why? Thank you.

