8
$\begingroup$

As a follow up to How the polar coordinate, $\theta$, is distributed when $(x,y) \sim U(-1,1) \times U(-1,1)$ and if $(x,y) \sim N(0,1)\times N(0,1)$?

Assume $(x,y,z) \sim U(-10,10) \times U(-10,10) \times U(-10,10)$ how are $\theta$ and $\phi$ distributed?

It's clearly from the wonderful answers of the previous question that $\theta$ looks like that: enter image description here

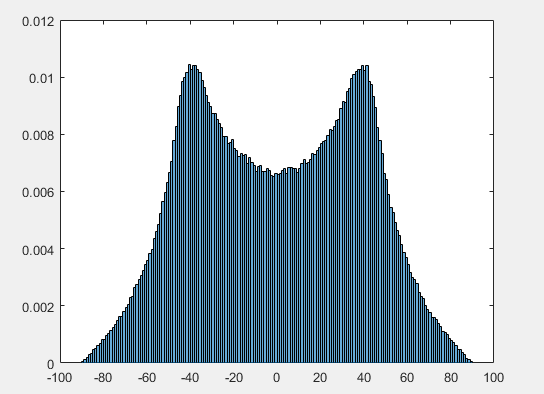
But why the $\phi$ doesn't get maximum likelihood at $\phi = \pi/4$?

enter image description here

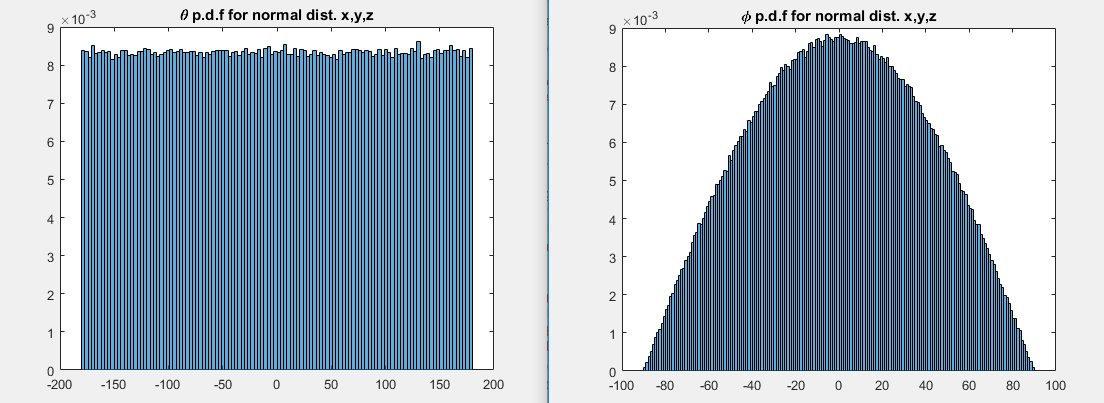
If we select $x,y,z$ in normally distribution fashion we get this 2 p.d.f's:

enter image description here

Is there a name for $\theta$ and $\phi$ distributions in both cases? For me it looks like $\beta$ distribution on the interval $[-90,90]$.

$\endgroup$
6
  • 1
    $\begingroup$ That last one is not a beta distribution. Think in trig functions; noting how the angles relate to the Cartesian co-ordinates. $\endgroup$
    – Glen_b
    Commented Jan 25, 2017 at 2:45
  • 2
    $\begingroup$ Since we're only considering the angles, you can project onto the sphere; in the Gaussian case you'll have a uniform distribution on the sphere,but note that in that situation the latitude is not uniform. Several questions on site discuss some of the issues, but basic arguments not greatly different from the previous question can get you there. See for example the discussion if inclination angle here $\endgroup$
    – Glen_b
    Commented Jan 25, 2017 at 2:49
  • $\begingroup$ I meant to ask earlier -- you should define your $\theta$ and $\phi$. I have assumed what they are from your discussion but it would be nice to confirm we're on the same page for that. I've posted an answer now that should clarify why it's not beta-distributed. $\endgroup$
    – Glen_b
    Commented Jan 25, 2017 at 6:59
  • $\begingroup$ I don't believe your second graphic. When the points are uniformly distributed in a a cube, a latitude ($\phi$) of $\pm\pi/2$ will not have a density of zero! The last two histograms are indeed Beta distributions; that result generalizes to higher dimensions. You can find accounts of that here: search for "sphere" and "Beta" together. $\endgroup$
    – whuber
    Commented Jan 30, 2017 at 23:52
  • 2
    $\begingroup$ I apologize: you are correct. I have been able to confirm the details of your histograms. I need to recalibrate my intuition--and therefore am grateful for what you have pointed out (+1). $\endgroup$
    – whuber
    Commented Jan 31, 2017 at 14:45

2 Answers 2

7
$\begingroup$

In my discussion here I am assuming your $\theta$ is effectively a longitude and $\phi$ is effectively a latitude. Perhaps more typical spherical co-ordinates use an angle down from the north pole rather than up from the equator and swap the roles of the two symbols from that - but it's no problem to deal with it either way, so I'll stick with what your notation appears to be.
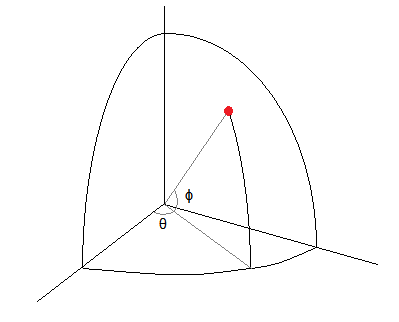
Graphic indicating the angles as they appear to be used in the question

Note that the distribution of radius is not of interest here, only the angles, so we could project everything onto a unit sphere without changing the angles. This is quite useful in the normal case.

With a spherically symmetric distribution like the three dimensional standard normal, the appearance of the distribution of inclination has to do with the fact that there's a lot more area on the surface of a sphere near the equator than near the poles.
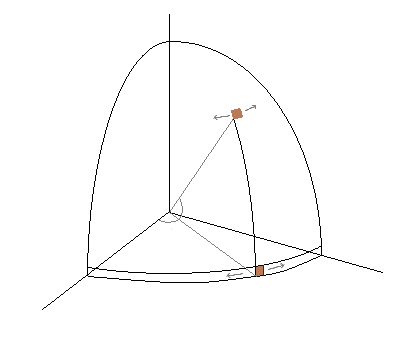
Graphic showing more area at latitudes near the equator

If you follow through the mathematics (or write a geometric argument in terms of elements of probability similar to the earlier 2D question), you can get that the inclination should have a density proportional to $\cos(\phi)$. Here's a geometrical argument that should motivate it in the "elements of probability" terms:
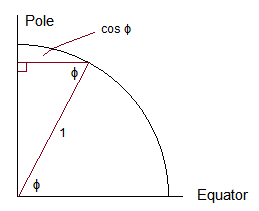
Picture showing radius at latitude phi is cos(phi)

Since the radius at the equator is 1 and the radius at latitude $\phi$ is $\cos(\phi)$, the circumference at latitude $\phi$ is proportional to $\cos(\phi)$, and so the density at $\phi$ is proportional to $\cos(\phi)$.


Uniform case: With the 3D-uniform normalized to constant radius, you don't have uniformity of density on the sphere for the same reason that we didn't in the 2D case - when you project onto the sphere, there's a lot more "density" on the sphere near the angles where the corners are than where the sides are (with parts near the middle of the edges being in between) -- because there's more of the volume of the cube for angles close to the corners than for angles near the middle of the faces.

We can see this by generating many random values uniformly in the cube and projecting them onto the sphere. Since there's more volume near the corners than near the faces of the cube, there's greater density looking "inward" from the corners than the faces. If we plot the height (recall this is a projected-z-value, $z^* = z/r$, where $r=\sqrt{x^2+y^2+z^2}$) above the equator against the longitude, we get the top plot below:

plot of many random uniform values in the cube $[-1,1]^3$ projected onto the unit sphere, transformed to (i) height/longitude and (ii) latitude/longitude

That height corresponds to the vertical side of the right triangle in the previous diagram; that height is the $\sin$ of $\phi$ ($z^*=\sin(\phi)$). To convert that to the latitude ($\phi$), we would take the arcsin of that projected vertical height, which is what we see in the lower plot. This "stretches" things more the closer we get to the pole, making the density as a function of latitude drop to 0 at the north and south pole (for both the uniform and for the normal case).

The density for $\phi$ will then be the integral of that bivariate density over $\theta$.
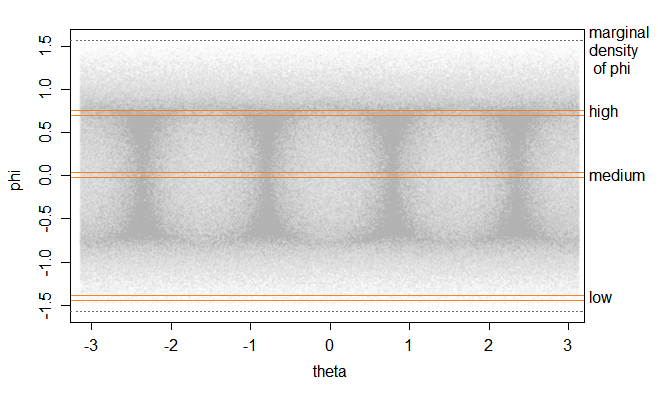
Image of bivariate theta-phi density showing integration to calculate marginal for phi

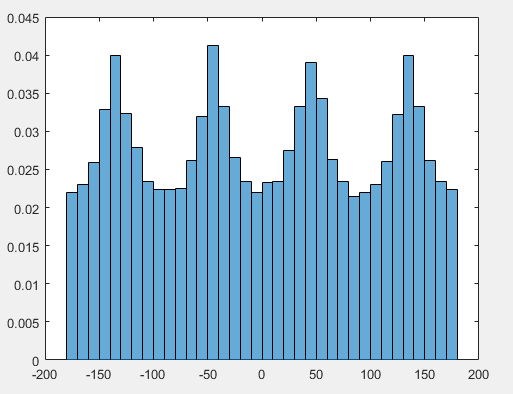
Looking at the marginal for $\theta$ (i.e. strips running down at fixed values of $\theta$) makes for four peaks in the density of $\theta$ as you note - indeed this follows directly from the 2D case, but as we now see, it also makes for a pair of peaks in the density of $\phi$ away from the equator, corresponding to a region on the surface of the unit sphere where the corners and upper/lower edges of the cube project.
$\endgroup$
4
  • $\begingroup$ Out of curiosity, what program do you use for drawing? $\endgroup$
    – 0x90
    Commented Jan 25, 2017 at 11:42
  • 4
    $\begingroup$ @0x90 I did those 3D drawings in paint. By hand. (You can probably remove that last plot in your question since it was based on a mistaken placement of parentheses.) $\endgroup$
    – Glen_b
    Commented Jan 25, 2017 at 12:01
  • $\begingroup$ The uniform case cannot possibly give the histogram of $\phi$ shown in the question. Thus, a quantitative response to that part of the question would be most useful. $\endgroup$
    – whuber
    Commented Jan 30, 2017 at 23:56
  • $\begingroup$ @whuber actually I agree with 0x90's plot for $\phi$. Looking at my drawing of the slice through a sphere, after converting to points on the unit sphere (in rectangular co-ordinates), the angle up from the equator would be the arcsin of the z-coordinate, would it not? I think that produces what we see for the two histograms of $\phi$ in the question $\endgroup$
    – Glen_b
    Commented Jan 31, 2017 at 1:07
6
$\begingroup$

The complementary cumulative distribution for the spherical latitude $\phi$ gives the chance that a random point in the cube $[-1,1]^3$ will lie above the cone that graphs the function $z = \cot(\phi)\sqrt{x^2+y^2}$. Because these points are uniformly distributed throughout the cube (which has a volume of $8$), this chance is one-eighth the volume between the cone and the top of the cube. When the latitude exceeds $\pi/4$, this volume is that of a right cone with height $1$ and base $\cot(\phi)$, equal to

$$F_{+}(\phi) = \frac{1}{8}\frac{\pi}{3}\cot^2(\phi).$$

See the two righthand plots in the figure.

When the latitude is less than $\arctan(1/\sqrt{2})$, this is the volume of the intersection of a semi-infinite cone and the cube. An integration in polar coordinates gives the expression

$$F_{-}(\phi) = \frac{1}{8}\left(4-\frac{4}{3} \tan (\phi ) \left(\sqrt{2}+2 \tanh ^{-1}\left(\tan \left(\frac{\pi }{8}\right)\right)\right)\right).$$

See the two leftmost plots in the figure.

Figures

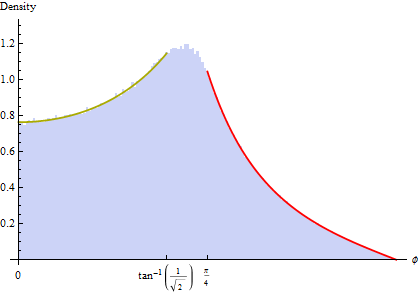
The negative derivatives of these expressions give the density. Between $\arctan(1/\sqrt{2})\approx \pi/5$ and $\pi/4$ is a transition region where the intersection of the cone with the cube is complicated. Although an exact expression could be developed, it would be messy. What we do know is that the density must change continuously from the derivative of $-F_{-}$ to the derivative of $-F_{+}$ as $\phi$ varies between those points. This is shown in a histogram of a million simulated values (from the upper half of the cube only--the lower half will be a mirror image). The gold curve is the graph of $-\frac{d}{d\phi}F_{-}$ while the red curve at the right is the graph of $-\frac{d}{d\phi}F_{+}.$

Histogram

This clarifies why the modes are not at $\phi=\pm \pi/4$, but must lie between these values and $\pm \arctan(1/\sqrt{2})$.

$\endgroup$

Your Answer

By clicking “Post Your Answer”, you agree to our terms of service and acknowledge you have read our privacy policy.

Not the answer you're looking for? Browse other questions tagged or ask your own question.