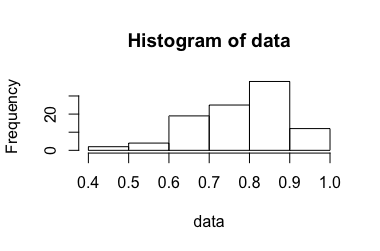
Consider an experiment that outputs a ratio $X_i$ between 0 and 1. How this ratio is obtained should not be relevant in this context. It was elaborated in a previous version of this question, but removed for clarity after a discussion on meta.
This experiment is repeated $n$ times, while $n$ is small (about 3-10). The $X_i$ are assumed to be independent and identically distributed. From these we estimate the mean by calculating the average $\overline X$, but how to calculate a corresponding confidence interval $[U,V]$?
When using the standard approach for calculating confidence intervals, $V$ is sometimes larger than 1. However, my intuition is that the correct confidence interval...
- ... should be within the range 0 and 1
- ... should get smaller with increasing $n$
- ... is roughly in the order of the one calculated using the standard approach
- ... is calculated by a mathematically sound method
These are not absolute requirements, but I would at least like to understand why my intuition is wrong.
Calculations based on existing answers
In the following, the confidence intervals resulting from the existing answers are compared for $\{X_i\} = \{0.985,0.986,0.935,0.890,0.999\}$.
Standard Approach (aka "School Math")
$\overline X = 0.959$, $\sigma^2 = 0.0204$, thus the 99% confidence interval is $[0.865,1.053]$. This contradicts intuition 1.
Cropping (suggested by @soakley in the comments)
Just using the standard approach then providing $[0.865,1.000]$ as result is easy to do. But are we allowed to do that? I am not yet convinced that the lower boundary just stays constant (--> 4.)
Logistic Regression Model (suggested by @Rose Hartman)
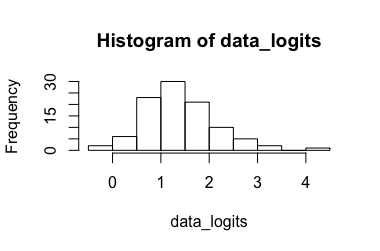
Transformed data: $\{4.18,4.25,2.09,2.66,6.90\}$ Resulting in $[0.173,7.87]$, transforming it back results in $[0.543,0.999]$. Obviously, the 6.90 is an outlier for the transformed data while the 0.99 is not for the untransformed data, resulting in a confidence interval that is very large. (--> 3.)
Binomial proportion confidence interval (suggested by @Tim)
The approach looks quite good, but unfortunately it does not fit the experiment. Just combining the results and interpreting it as one large repeated Bernoulli experiment as suggested by @ZahavaKor results in the following:
$985+986+890+935+999 = 4795$ out of $5*1000$ in total. Feeding this into the Adj. Wald calculator gives $[0.9511,0.9657]$. This does not seem to be realistic, because not a single $X_i$ is inside that interval! (--> 3.)
Bootstrapping (suggested by @soakley)
With $n=5$ we have 3125 possible permutations. Taking the $\frac{3093}{3125} = 0.99$ middle means of the permutations, we get $[0.91,0.99]$. Looks not that bad, though I would expect a larger interval (--> 3.). However, it is per construction never larger than $[min(X_i),max(X_i)]$. Thus for a small sample it will rather grow than shrink for increasing $n$ (--> 2.). This is at least what happens with the samples given above.


