2
$\begingroup$

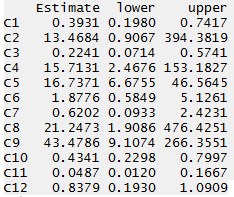
I have estimated a binary logit and calculated the odds ratios and their LR confidence intervals as follows:

enter image description here

As you see some of these intervals are extremely wide. I guess it is due to insufficient variability in those variables (but I am not sure). How should I interpret these in a research paper? Should I just say (e.g. for C8) "c unit increase in x changes the odds of success by 1.9086 to 476.4251 times, with 95% confidence"? I am sure the reviewers will find this and point at it. What is your suggestion?

$\endgroup$
4
  • 1
    $\begingroup$ Odds can be pretty misleading. People generally tend to use the word "odds" when technically they are referring to probabilities. I understand that in some contexts, odds are desired over probabilities. However, that's often not the case. And you can simply convert the bounds on your odds into bounds on probabilities. For C8, you could say "we are 95% confident that a c unit increase in x changes the [probability] of success by [1.91/(1+1.91)=.655] to [476.4/(1+476.4=.998]." $\endgroup$
    – jjet
    Commented Apr 21, 2017 at 19:45
  • 1
    $\begingroup$ @jjet I agree with your comment up until your calculation. The change in prob. of success (or the range of such change) will not be constant across the dataset, but will vary depending on the baseline or benchmark prob. of the group of cases to which one is comparing. I.e., 1.91 is an odds ratio, not an odds. $\endgroup$
    – rolando2
    Commented Apr 22, 2017 at 12:37
  • $\begingroup$ @rolando2 good catch. I didn't read closely enough to see that he was referring to odds ratios. $\endgroup$
    – jjet
    Commented Apr 22, 2017 at 14:42
  • $\begingroup$ @jjet The reason using odds ratios in the interpretation of binary logit models (logistic regression) is preferred to probabilities (or elasiticities, as econometricians do) is that in binary logit odds ratios are independent of the value of the explanatory variable or other explanatory variables. This is not true for probabilities. The amount of change in proabilities for each c unit change in an explanatory variable is not the same for different values of the explanatory variable. $\endgroup$
    – Fred
    Commented Apr 23, 2017 at 17:35

2 Answers 2

3
$\begingroup$

There is a very good paper on this at http://www.scielosp.org/pdf/rpsp/v2n4/v2n4a7.pdf

There are multiple reasons for this, including software failure. They test eight standard software tools and set in motion a configuration of data that should trigger software failure.

As to causes, they list

These problems include, inter alia, the instability of the model due to inadequate sample size; the problem of “complete separation” that occurs when all subjects whose outcome variable is equal to 1 can be perfectly separated from those whose outcome variable is equal to 0, based on their characteristics; the colinearity problem; and, finally, the problem of profiles with a frequency equal to 0.

Rather than opine on possible causes and as you know your data set, I suggest reading the paper and taking a close look at your data. They run eight programs on the same data set and get eight very different answers for coefficients.

$\endgroup$
3
  • $\begingroup$ This question seems to relate to that reference also? $\endgroup$
    – GeoMatt22
    Commented Apr 22, 2017 at 21:03
  • $\begingroup$ Yes, thogh their specific question was software failure. $\endgroup$ Commented Apr 23, 2017 at 5:14
  • 2
    $\begingroup$ Thank you for your answer. I used penalized maximum likelihood instead of maximum likelihood (brglm() package in r) to address possible complate separation and it turned out some of my variance estimations were not correct and were too big. Now the confidence intervals are so much better, although there are still some wide ones but better. $\endgroup$
    – Fred
    Commented Apr 23, 2017 at 17:39
5
$\begingroup$

I am not familiar with the standards in this area, but note that (as suggested by @jjet in the comments) the numerical value of an odds will vary strongly with the value of the underlying probability. So "linear intuitions" may be misleading.

If the odds is defined by $$o=\frac{p}{1-p}$$ then its sensitivity will be $$\frac{do}{dp}=\big(1+o\big)^2$$

Another way to look at it is that the change in $o$ will be exponential relative to a change in the $\beta$ coefficient that multiplies $x$.

I myself would probably report probabilities rather than odds (as indicated by @jjet). Or alternatively you could just report log-odds. However I would check similar articles in your field to see what the standard is for reporting.

(Note: This is all assuming you are confident there are not artifacts in the results, as suggested in Dave Harris's answer.)

$\endgroup$
2
  • $\begingroup$ Thank you. I would love to stick to probabilities, since they are way more tangible to me or any reader. But as I told jjet, the reason for using odds ratios is that they are very convenient to use with logistic regression, since they are independent of the value of the variables. $\endgroup$
    – Fred
    Commented Apr 23, 2017 at 17:42
  • $\begingroup$ Yes, I had not fully appreciated that before! (I am new to logistic regression.) For some readers (probably not reviewers), the exponential part could be perhaps non-intuitive I imagine? For that I might express uncertainties in "percent" terms still? (i.e. $\Delta{r}/r_0$ where $r=\text{odds ratio}$, $\log{r}=\Delta\log{o}\sim\beta\Delta{x}$) Probably depends on the audience. $\endgroup$
    – GeoMatt22
    Commented Apr 23, 2017 at 19:50

Your Answer

By clicking “Post Your Answer”, you agree to our terms of service and acknowledge you have read our privacy policy.

Not the answer you're looking for? Browse other questions tagged or ask your own question.