67
$\begingroup$

A basic limitation of null hypothesis significance testing is that it does not allow a researcher to gather evidence in favor of the null (Source)

I see this claim repeated in multiple places, but I can't find justification for it. If we perform a large study and we don't find statistically significant evidence against the null hypothesis, isn't that evidence for the null hypothesis?

$\endgroup$
12
  • 3
    $\begingroup$ But we start off our analysis by assuming the null hypothesis is correct... The assumption might be wrong. Maybe we don't have enough power but that doesn't mean the assumption is correct. $\endgroup$
    – SmallChess
    Commented Apr 25, 2017 at 4:59
  • 13
    $\begingroup$ If you haven't read it, I highly recommend Jacob Cohen's The Earth is Round (p < .05). He emphasizes that with a big enough sample size, you can reject pretty much any null hypothesis. He also speaks in favor of using effect sizes and confidence intervals, and he offers a neat presentation of Bayesian methods. Plus, it's a pure delight to read! $\endgroup$ Commented Apr 25, 2017 at 7:00
  • 8
    $\begingroup$ Null hypotheses can be only just wrong. ... failure to reject the null is not evidence against a sufficiently close alternative. $\endgroup$
    – Glen_b
    Commented Apr 25, 2017 at 8:19
  • 4
    $\begingroup$ See stats.stackexchange.com/questions/85903. But see also stats.stackexchange.com/questions/125541. If by performing "a large study" you mean "large enough to have high power to detect the minimal effect of interest", then failure to reject can be interpreted as accepting the null. $\endgroup$
    – amoeba
    Commented Apr 25, 2017 at 11:38
  • 7
    $\begingroup$ Consider Hempel's paradox of confirmation. Examining a crow and seeing that it is black is support for "all crows are black". But logically examining a non-black object, and seeing that it is not a crow, must also support the proposition since the statements "all crows are black" and "all non-black objects are not crows" are logically equivalent... The resolution is that the number of non-black objects is much, much larger than the number of crows, so the support that a black crow gives to the proposition is correspondingly larger than the tiny support that a non-black non-crow gives. $\endgroup$
    – Ben
    Commented Apr 27, 2017 at 19:41

14 Answers 14

68
+50
$\begingroup$

Failing to reject a null hypothesis is evidence that the null hypothesis is true, but it might not be particularly good evidence, and it certainly doesn't prove the null hypothesis.

Let's take a short detour. Consider for a moment the old cliché:

Absence of evidence is not evidence of absence.

Notwithstanding its popularity, this statement is nonsense. If you look for something and fail to find it, that is absolutely evidence that it isn't there. How good that evidence is depends on how thorough your search was. A cursory search provides weak evidence; an exhaustive search provides strong evidence.

Now, back to hypothesis testing. When you run a hypothesis test, you are looking for evidence that the null hypothesis is not true. If you don't find it, then that is certainly evidence that the null hypothesis is true, but how strong is that evidence? To know that, you have to know how likely it is that evidence that would have made you reject the null hypothesis could have eluded your search. That is, what is the probability of a false negative on your test? This is related to the power, $\beta$, of the test (specifically, it is the complement, 1-$\beta$.)

Now, the power of the test, and therefore the false negative rate, usually depends on the size of the effect you are looking for. Large effects are easier to detect than small ones. Therefore, there is no single $\beta$ for an experiment, and therefore no definitive answer to the question of how strong the evidence for the null hypothesis is. Put another way, there is always some effect size small enough that it's not ruled out by the experiment.

From here, there are two ways to proceed. Sometimes you know you don't care about an effect size smaller than some threshold. In that case, you probably should reframe your experiment such that the null hypothesis is that the effect is above that threshold, and then test the alternative hypothesis that the effect is below the threshold. Alternatively, you could use your results to set bounds on the believable size of the effect. Your conclusion would be that the size of the effect lies in some interval, with some probability. That approach is just a small step away from a Bayesian treatment, which you might want to learn more about, if you frequently find yourself in this sort of situation.

There's a nice answer to a related question that touches on evidence of absence testing, which you might find useful.

$\endgroup$
23
  • 11
    $\begingroup$ Let's consider a hypothesis test with $H_1:\mu>2$, with $\bar{x}=3$ and a non-significant p-value. According to your reasoning, this is some evidence for $\mu \le 2$. Another hypothesis test with $H_1:\mu<4$, with $\bar{x}=3$ and a non-significant p-value, would then provide some evidence for $\mu \ge 4$. This evidences are obviously contradicting. $\endgroup$
    – Macond
    Commented Apr 25, 2017 at 20:50
  • 4
    $\begingroup$ I'm not sure I follow your argument. From what I can tell you're describing two experiments, each of which supplies (probably quite weak) evidence for one of two mutually inconsistent hypotheses. Why is this surprising? $\endgroup$
    – Nobody
    Commented Apr 25, 2017 at 21:28
  • 9
    $\begingroup$ Another example: common $H_0: \mu = 0$. If you fail to reject it does it mean that you have evidence that among all other values on real line, the true mean is exactly 0..? This answer is misleading! $\endgroup$
    – Tim
    Commented Apr 25, 2017 at 22:05
  • 3
    $\begingroup$ I like your account of evidence - it seems to lead quickly to the Bayes factor as quantifying the data's support of one model vs another. Does $\bar{x}=3$ give evidence for or against $\mu\leq2$? Well it depends on your prior density for $\mu$: if you think that $\mu$'s either somewhere just under 2 or somewhere much higher than 3, the data provide evidence for it; if you think $\mu$'s equally likely to be anywhere between -10 & 10 , the data provide evidence against it. But in a frequentist analysis your degree of belief isn't represented by a number, so what concept of evidence applies? $\endgroup$
    – Scortchi
    Commented Apr 26, 2017 at 19:46
  • 6
    $\begingroup$ It reminds me of the Riemann hypothesis. We looked and looked for non trivial zeros outside the line with real part 1/2, but couldn't find any. And while we don't consider the Riemann hypothesis true because we didn't prove it, most mathematicians believe it is true and there are lots of results that are true conditionally on the Riemann hypothesis being true :) So in this case we have interpreted absence of evidence as evidence for absence $\endgroup$
    – Ant
    Commented Apr 28, 2017 at 11:20
29
$\begingroup$

NHST relies on p-values, which tell us: Given the null hypothesis is true, what is the probability that we observe our data (or more extreme data)?

We assume that the null hypothesis is true—it is baked into NHST that the null hypothesis is 100% correct. Small p-values tell us that, if the null hypothesis is true, our data (or more extreme data) are not likely.

But what does a large p-value tell us? It tells us that, given the null hypothesis, our data (or more extreme data) are likely.

Generally speaking, P(A|B) ≠ P(B|A).

Imagine you want to take a large p-value as evidence for the null hypothesis. You would rely on this logic:

  • If the null is true, then a high p-value is likely. (Update: Not true. See comments below.)
  • A high p-value is found.
  • Therefore, the null is true.

This takes on the more general form:

  • If B is true, then A is likely.
  • A occurs.
  • Therefore, B is true.

This is fallacious, though, as can be seen by an example:

  • If it rained outside, then the ground being wet is likely.
  • The ground is wet.
  • Therefore, it rained outside.

The ground could very well be wet because it rained. Or it could be due to a sprinkler, someone cleaning their gutters, a water main broke, etc. More extreme examples can be found in the link above.

It is a very difficult concept to grasp. If we want evidence for the null, Bayesian inference is required. To me, the most accessible explanation of this logic is by Rouder et al. (2016). in paper Is There a Free Lunch in Inference? published in Topics in Cognitive Science, 8, pp. 520–547.

$\endgroup$
13
  • 3
    $\begingroup$ I don't like that all of your examples conclude "X is true". Having evidence for something is not the same thing as concluding something with 100% certainty. If I go outside and the ground is wet, that is evidence for "it rained". That evidence makes it much more likely that rain has occurred. $\endgroup$
    – bkoodaa
    Commented Apr 25, 2017 at 5:48
  • $\begingroup$ That's fair. That Rouder et al. paper I linked to at the end of my answer does not have examples that have conclusions with certainty. $\endgroup$
    – Mark White
    Commented Apr 25, 2017 at 5:55
  • 7
    $\begingroup$ @AtteJuvonen yes, we have some evidence for rain, but we do not know how likely it is, so the only conclusion that you can make is that "it could have rained, or it could have been something else that made ground wet". So you have inconclusive evidence. Only on the grounds of Bayesian statistics you can make the opposite argument. $\endgroup$
    – Tim
    Commented Apr 25, 2017 at 8:43
  • 3
    $\begingroup$ I disagree with your conclusion "If we want evidence for the null, Bayesian inference is required"; the study that you are citing is from Wagenmakers who is a very vocal hard-core proponent of Bayesian statistics so obviously they argues that. But in fact one can easily have evidence "for the null" in the frequentist paradigm, e.g. by conducting TOST (two one-sided tests) for equivalence. (cc @AtteJuvonen). $\endgroup$
    – amoeba
    Commented Apr 25, 2017 at 11:48
  • 10
    $\begingroup$ "If the null is true, then a high p-value is likely." - this is not correct. If the null hypothesis is true, then $p\sim U[0,1]$, so high $p$ values are no more likely than low ones under the null hypothesis. All you can say is that a high $p$ value is more likely under the null than under other hypotheses - but the hypotheses either hold or don't, so the hypotheses are not the probability space in which we are operating. Unless we work in a Bayesian paradigm! And that is where your argument unfortunately breaks down. $\endgroup$ Commented Apr 25, 2017 at 11:49
14
$\begingroup$

To grasp what is wrong with the assumption, see the following example:

Imagine an enclosure in a zoo where you can't see its inhabitants. You want to test the hypothesis that it is inhabited by monkeys by putting a banana into the cage and check if it is gone the next day. This is repeated N times for enhanced statistical significance.

Now you can formulate a null hypothesis: Given that there are monkeys in the enclosure, it is very probable that they will find and eat the banana, so if the bananas are untouched each day, it is very improbable that there are any monkeys inside.

But now you see that the bananas are gone (nearly) each day. Does that tell you that monkeys are inside?

Of course not, because there are other animals that like bananas as well, or maybe some attentive zookeeper removes the banana every evening.

So what is the mistake that is made in this logic? The point is that you do not know anything about the probability of bananas being gone if there are no monkeys inside. To corroborate the null hypothesis, the probability of vanishing bananas must be small if the null hypothesis is wrong, but this does not need to be the case. In fact, the event may be equally probable (or even more probable) if the null hypothesis is wrong.

Without knowing about this probability, you can say exactly nothing about the validity of the null hypothesis. If zookeepers remove all bananas each evening, the experiment is completely worthless, even though it seems on first glance that you have corroborated the null hypothesis.

$\endgroup$
10
  • $\begingroup$ I don't understand this answer (and I suspect that it can be misleading). Can you please explain how exactly your monkey example corresponds to hypothesis testing? What is the null hypothesis, what is the alternative hypothesis, etc. E.g. I am doing a t-test and my null hypothesis is that $\mu=0$. How does this correspond to your monkey example? $\endgroup$
    – amoeba
    Commented Apr 28, 2017 at 17:42
  • 2
    $\begingroup$ @amoeba In this case, null hyp would be that monkeys are in the cage. Alt hyp would be that no monkeys are in the cage. The samples I gather are the observations "banana gone" and "banana still there" each morning. Making several assumptions about monkeys and their ability to find bananas, I can calculate the probability p that I would have seen the actual result with monkeys in a cage. If bananas are still there often, I will reject the null hyp. If bananas are always gone, this fits to the null hyp, but it does not prove that monkeys are in the cage. $\endgroup$
    – Thern
    Commented Apr 28, 2017 at 19:53
  • 1
    $\begingroup$ @amoeba I am not sure if it is possible to directly translate the monkey example to your t-test scenario. To my knowledge, null hypothesis testing generally means what also Mark White wrote in his answer: "Given the null hypothesis is true, what is the probability that we observe our data (or more extreme data)?". Your t-testing scenario is a specific case of this, but I currently don't see how this scenario can be generalized. From my gut feeling, I would say that your scenario and the monkey example are two different ways of hypothesis testing that can't be mapped to each other directly. $\endgroup$
    – Thern
    Commented Apr 29, 2017 at 5:37
  • 1
    $\begingroup$ If so @Nebr, then I am again very confused about the meaning of your monkey example. T-test is probably the most common hypothesis test; I mentioned it in my comment just because it's such a typical example of a test. If your monkey example is not applicable (as you say) to this -- typical! -- situation, then I am puzzled about its meaning. In fact, if you say that t-test and monkey example are "two different ways of hypothesis testing", then can you give an example of statistical test that follows your monkey example "way"? What exactly is your monkey example an analogy of? $\endgroup$
    – amoeba
    Commented Apr 29, 2017 at 19:28
  • 1
    $\begingroup$ @Nebr I agree that it's a general question. But if you cannot give me a single example of a real statistical test that would have the same property as your monkey example, then I am sorry but I will have to consider your monkey example pretty much irrelevant for this thread. I am not saying that the monkey example has to correspond to a t-test specifically. But it has to correspond to something!! $\endgroup$
    – amoeba
    Commented May 2, 2017 at 7:38
14
$\begingroup$

In his famous paper Why Most Published Research Findings Are False, Ioannidis used Bayesian reasoning and the base rate-fallacy to argue that most findings are false-positives. Shortly, the post-study probability that a particular research hypothesis is true depends - among other things - on the pre-study probability of said hypothesis (i.e. the base rate).

As a response, Moonesinghe et al. (2007) used the same framework to show that replication greatly increases the post-study probability of a hypothesis being true. This makes sense: If multiple studies can replicate a certain finding, we are more sure that the conjectured hypothesis is true.

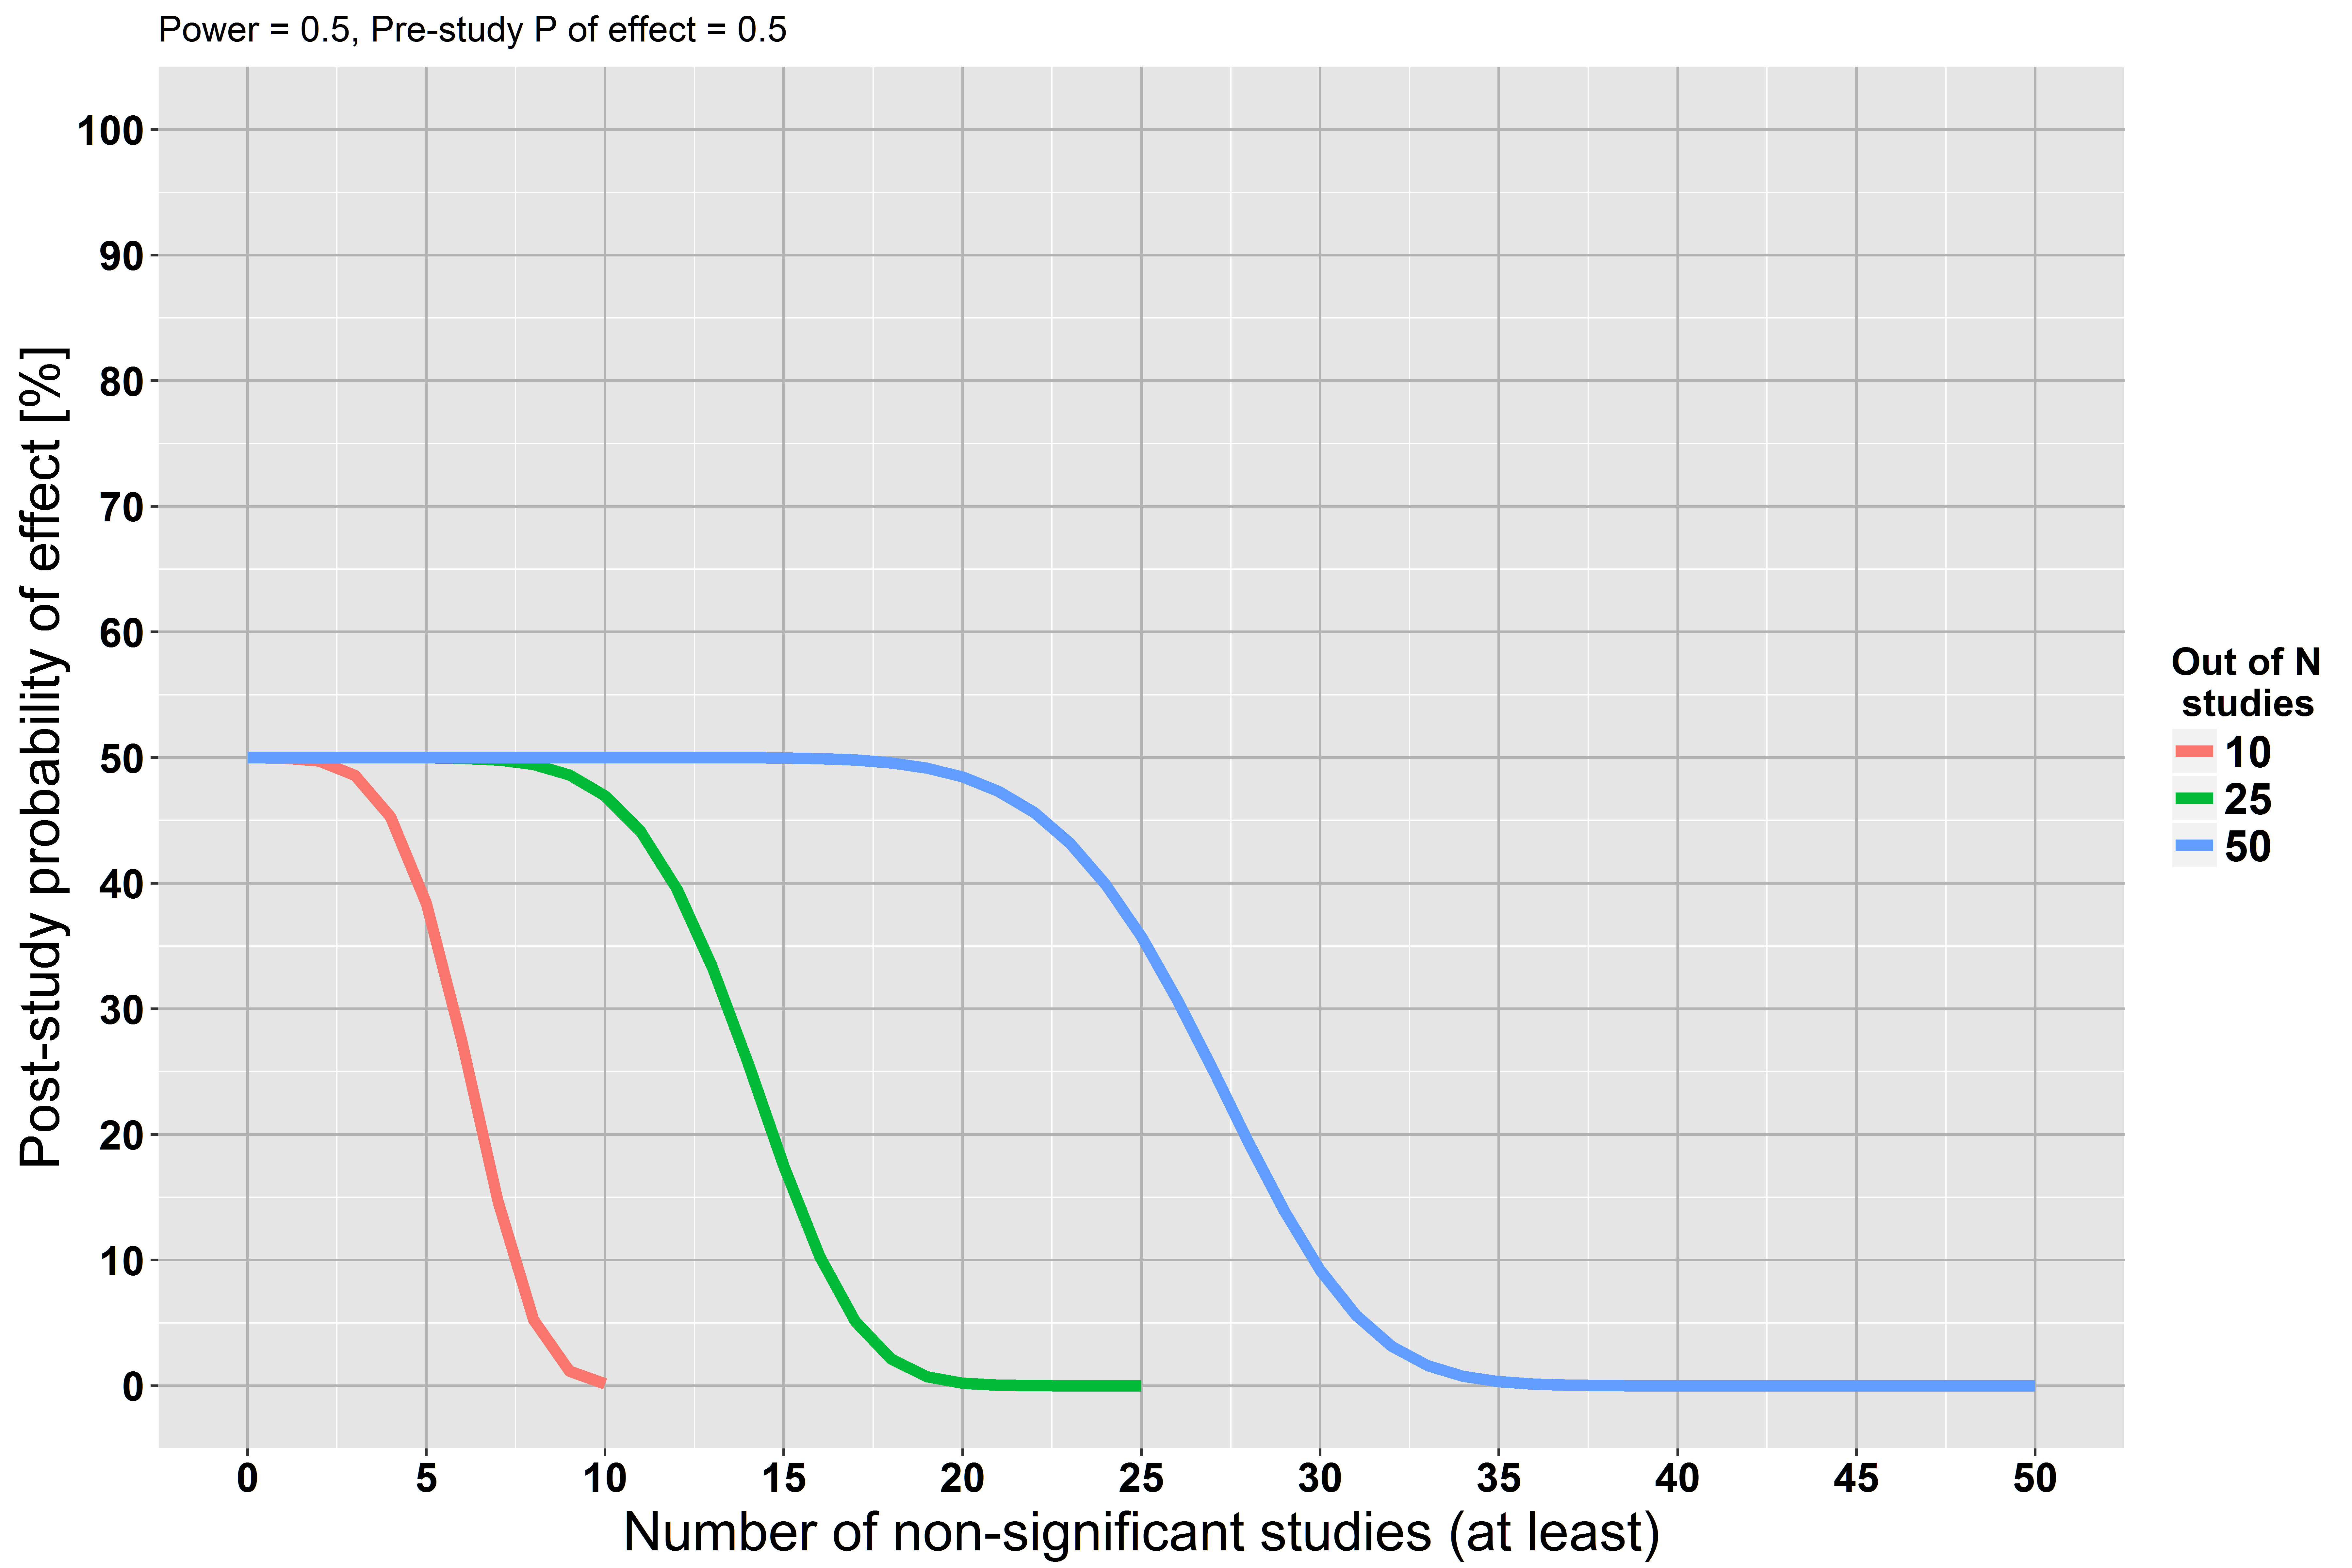
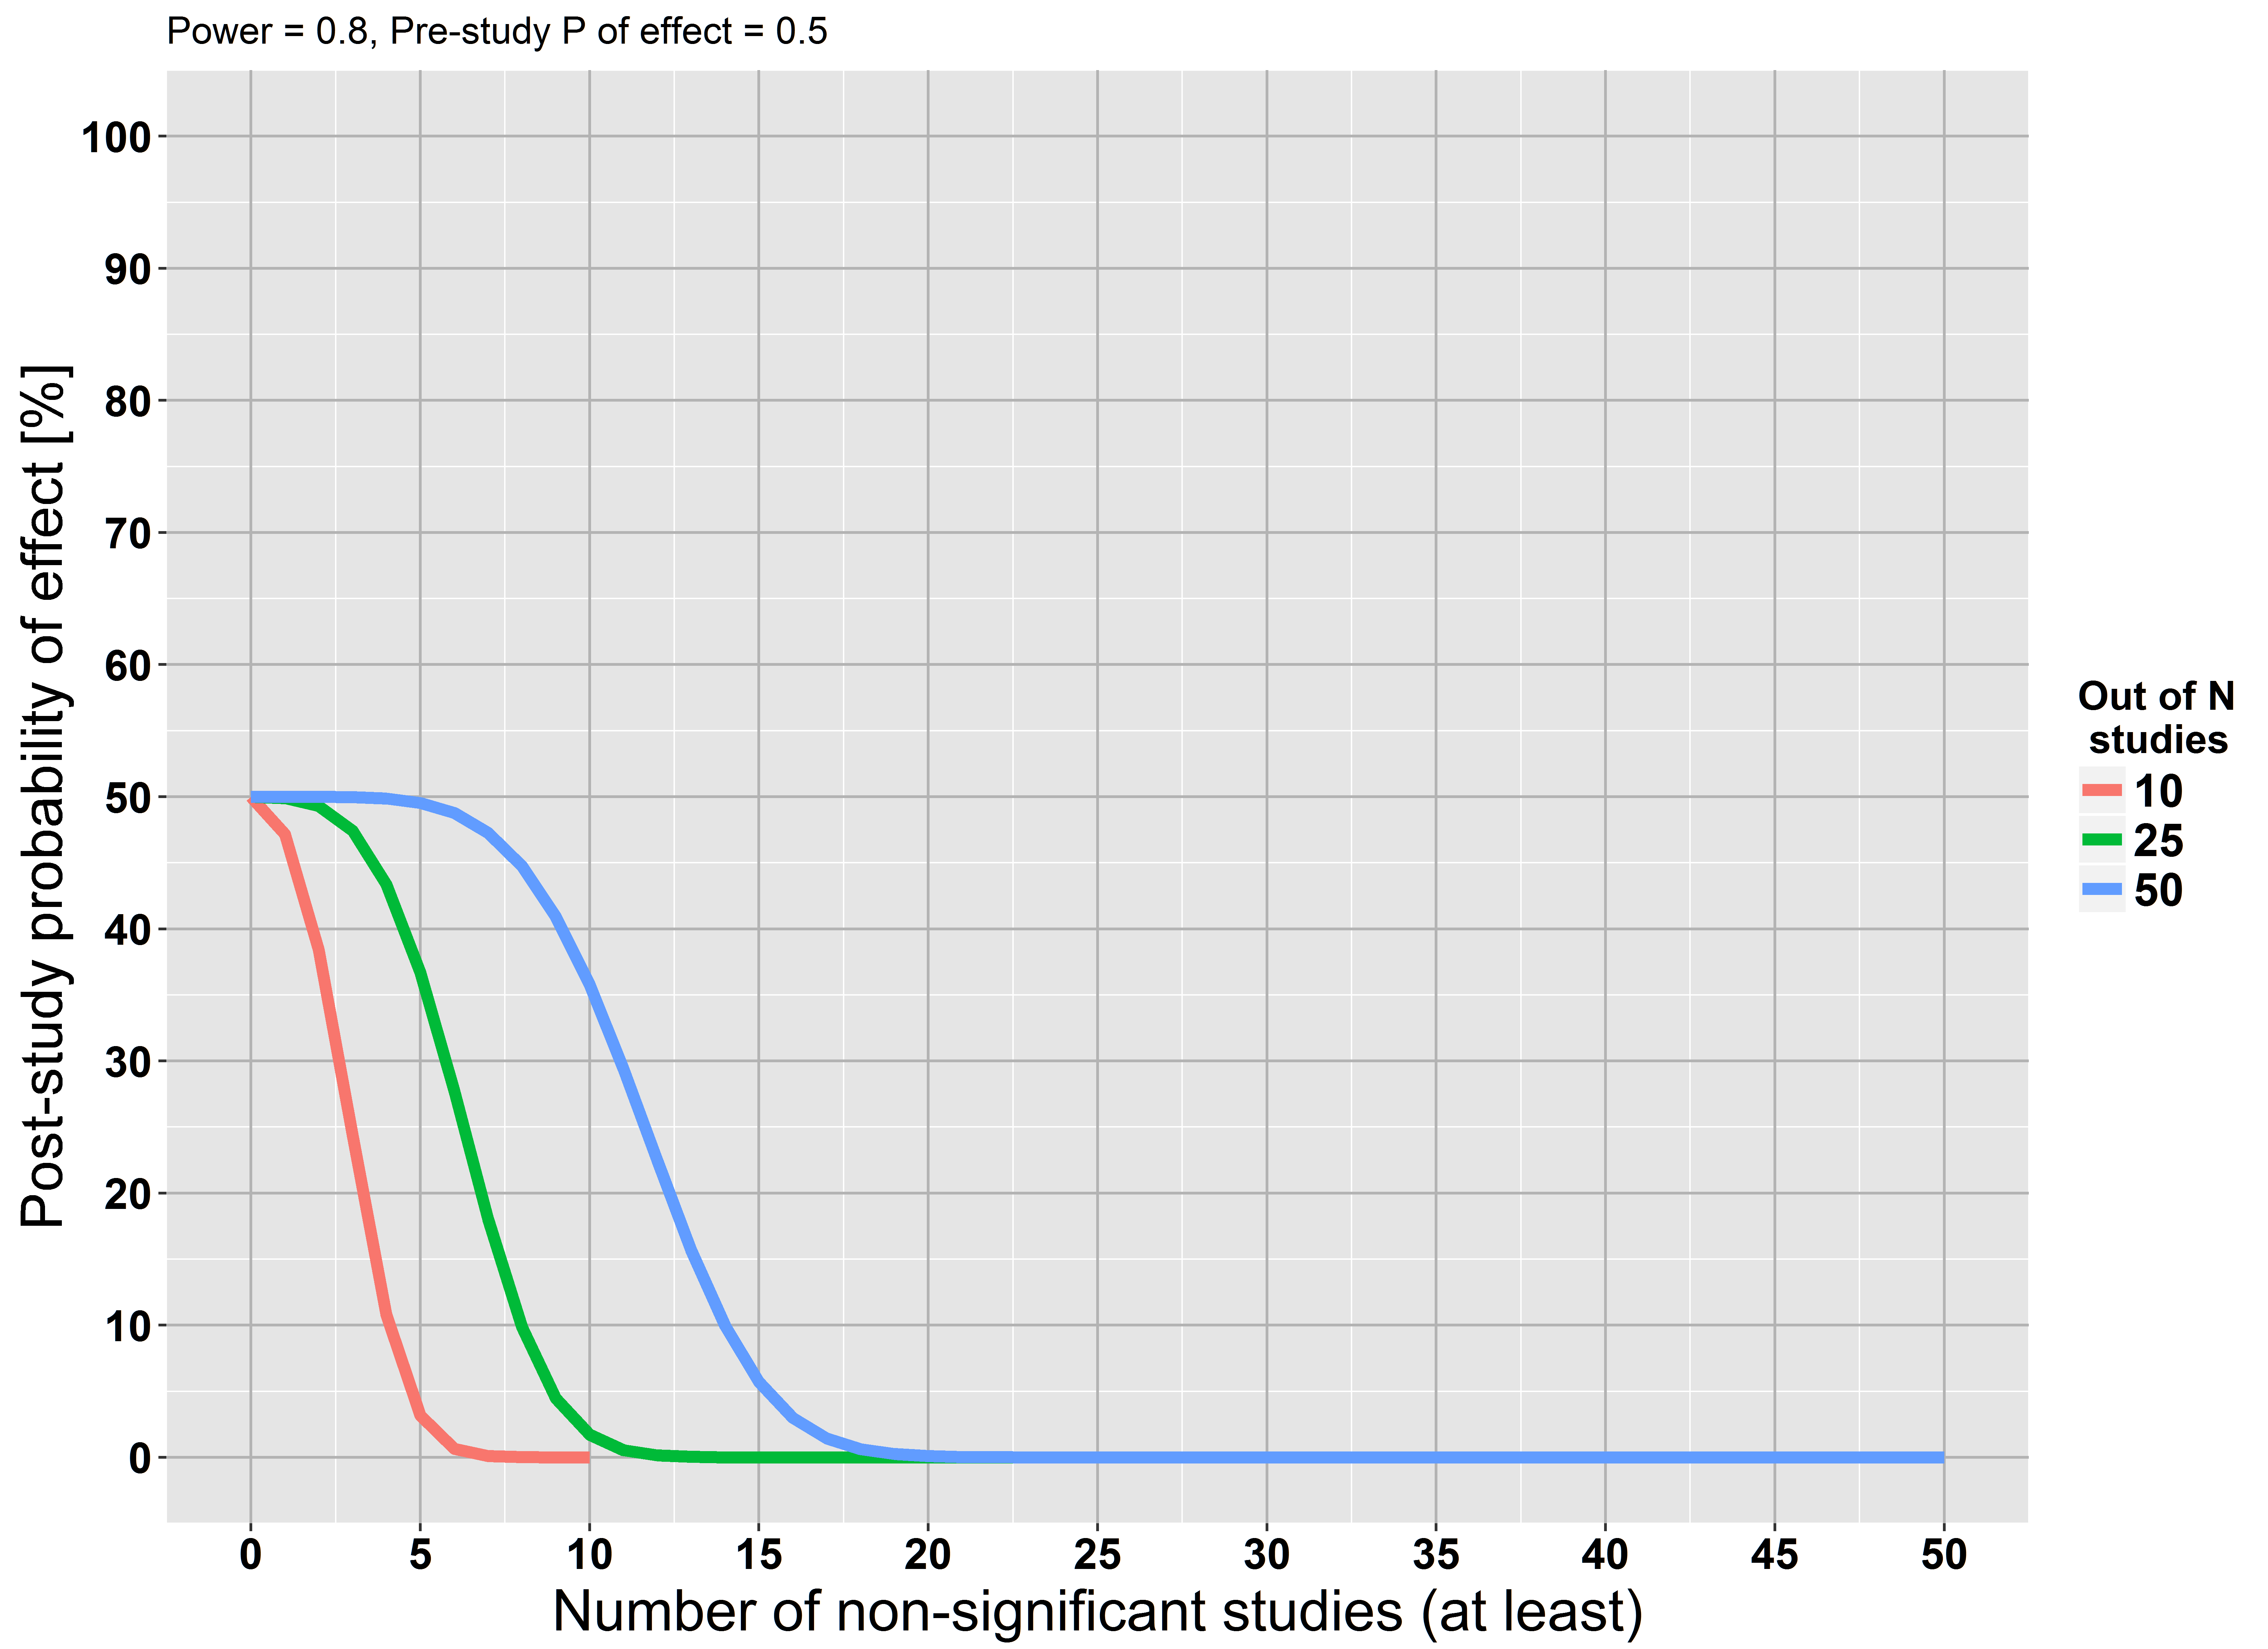
I used the formulas in Moonesinghe et al. (2007) to create a graph that shows the post-study probability in the case of a failure to replicate a finding. Assume that a certain research hypothesis has a pre-study probability of being true of 50%. Further, I'm assuming that all studies have no bias (unrealistic!) have a power of 80% and use an $\alpha$ of 0.05.Post-study probability

The graph shows that if at least 5 out of 10 studies fail to reach significance, our post-study probability that the hypothesis is true is almost 0. The same relationships exist for more studies. This finding also makes intuitive sense: A repeated failure to find an effect strengthens our belief that the effect is most likely false. This reasoning is in line with the accepted answer by @RPL.

As a second scenario, let's assume that the studies have only a power of 50% (all else equal).Post-study probability_pow50

Now our post-study probability decreases more slowly, because every study had only low power to find the effect, if it really existed.

$\endgroup$
11
  • $\begingroup$ Note that you get all evidence about the null hypothesis from cases where a test fails this hypothesis. But the assumption from the OP was that the tests corroborate the null hypothesis ("If we perform a large study and we don't find statistically significant evidence against the null hypothesis, isn't that evidence for the null hypothesis?"). This corresponds to the left-most part of your diagrams, and thus to a case where the probability of the effect is still 50% (or, in general, the pre-study probability), so you have gained nothing. $\endgroup$
    – Thern
    Commented Apr 26, 2017 at 7:52
  • $\begingroup$ @Nebr I don't understand. If we perform 1 large, well-powered study (say 95% power) and we fail to find evidence against the null hypothesis (i.e. a statistical hypothesis test is not-significant on the 5%-level), our post-study probability would be 0.05 in the mentioned framework (with a pre-study probability of 50%). $\endgroup$ Commented Apr 26, 2017 at 9:40
  • 1
    $\begingroup$ @Nebr Your last comment does not make any sense: if the result is not significant, it cannot possibly be a "false positive". $\endgroup$
    – amoeba
    Commented Apr 28, 2017 at 14:25
  • 1
    $\begingroup$ @Nebr If you have a negative, you found evidence against the null - What? The word "negative" has exactly the opposite meaning. A significant p-value is called a "positive" result; a non-significant is a "negative". $\endgroup$
    – amoeba
    Commented Apr 28, 2017 at 14:48
  • 1
    $\begingroup$ @Nebr 100% power does NOT mean "that if H0 is true, we can be sure that we will always see H1". It means that if H1 is true, we will always see H1. I will not attempt to read your comment any further, because every sentence is confusing. $\endgroup$
    – amoeba
    Commented Apr 28, 2017 at 15:02
13
$\begingroup$

The best explanation I've seen for this is from someone whose training is in mathematics.

Null-Hypothesis Significance Testing is basically a proof by contradiction: assume $H_0$, is there evidence for $H_1$? If there is evidence for $H_1$, reject $H_0$ and accept $H_1$. But if there isn't evidence for $H_1$, it's circular to say that $H_0$ is true because you assumed that $H_0$ was true to begin with.

$\endgroup$
1
10
$\begingroup$

If you do not like this consequence of hypothesis testing but are not prepared to make the full leap to Bayesian methods, how about a confidence interval?

Suppose you flip a coin $42078$ times and see $20913$ heads, leading to you saying that a 95% confidence interval for the probability of heads is $[0.492,0.502]$.

You have not said you have seen evidence that it is in fact $\frac12$, but the evidence suggests some confidence about how close it might be to $\frac12$.

$\endgroup$
2
  • 2
    $\begingroup$ What is Bayesian about a confidence interval? $\endgroup$ Commented Apr 25, 2017 at 18:00
  • 3
    $\begingroup$ @kjetilbhalvorsen: A confidence interval is not Bayesian (a credible interval would be), but a confidence interval gives more information about the evidence then a simple hypothesis rejection/non-rejection would $\endgroup$
    – Henry
    Commented Apr 25, 2017 at 22:31
10
$\begingroup$

It would perhaps be better to say that non-rejection of a null hypothesis is not in itself evidence for the null hypothesis. Once we consider the full likelihood of the data, which more explicitly considers the amount of the data, then the collected data may provide support for the parameters falling within the null hypothesis.

However, we should also carefully think about our hypotheses. In particular, failing to reject a point null hypothesis is not very good evidence that the point null hypothesis is true. Realistically, it accumulates evidence that the true value of the parameter is not that far away from the point in question. Point null hypotheses are to some extent rather artificial constructs and most often you do not truly believe they will be exactly true.

It becomes much more reasonable to talk about the non-rejection supporting the null hypothesis, if you can meaningfully reverse null and alternative hypothesis and if when doing so you would reject your new null hypothesis. When you try to do that with a standard point null hypothesis you immediately see that you can will never manage to reject its complement, because then your inverted null hypothesis contains values arbitrarily close to the point under consideration.

On the other hand, if you, say, test the null hypothesis $H_0: |\mu| \leq \delta$ against the alternative $H_A: |\mu| > \delta$ for the mean of a normal distribution, then for any true value of $\mu$ there is a sample size - unless unrealistically the true value of $\mu$ is $-\delta$ or $+\delta$ - for which we have almost 100% probability that a level $1-\alpha$ confidence interval will fall either completely within $[-\delta, +\delta]$ or outside of this interval. For any finite sample size you can of course get confidence intervals that lie across the boundary, in which case that is not all that strong evidence for the null hypothesis.

$\endgroup$
1
  • 2
    $\begingroup$ @amoeba because it was posted late, but I agree and already +1'd. $\endgroup$
    – Tim
    Commented Apr 29, 2017 at 9:01
6
$\begingroup$

It rather depends on how you are using language. Under Pearson and Neyman decision theory, it is not evidence for the null, but you are to behave as if the null is true.

The difficulty comes from modus tollens. Bayesian methods are a form of inductive reasoning and, as such, are a form of incomplete reasoning. Null hypothesis methods are a probabilistic form of modus tollens and as such are part of deductive reasoning and therefore is a complete form of reasoning.

Modus tollens has the form "if A is true then B is true, and B is not true; therefore A is not true." In this form, it would be if the null is true then the data will appear in a particular manner, they do not appear in that manner, therefore (to some degree of confidence) the null is not true (or at least is "falsified."

The problem is that you want "If A then B and B." From this, you wish to infer A, but that is not valid. "If A then B," does not exclude "if not A then B" from also being a valid statement. Consider the statement "if it is a bear, then it can swim. It is a fish (not a bear)." The statements say nothing about the ability of non-bears to swim.

Probability and statistics are a branch of rhetoric and not a branch of mathematics. It is a heavy user of math but is not part of math. It exists for a variety of reasons, persuasion, decision making or inference. It extends rhetoric into a disciplined discussion of evidence.

$\endgroup$
1
5
$\begingroup$

I'll try to illustrate this with an example.

Let us think that we are sampling from a population, with an intention of test for its mean $\mu$. We get a sample with mean $\bar{x}$. If we get a non-significant p-value, we would also get non-significant p-values if we had tested for any other null hypothesis $H_0:\mu=\mu_i$, such that $\mu_i$ is between $\mu_0$ and $\bar{x}$. Now for what value of $\mu$ do we have evidence?

Also when we get significant p-values, we do not obtain evidence for a particular $H_1:\mu=M$, instead it is an evidence against $H_0:\mu=\mu_0$ (which can be tought as evidence for $\mu\ne\mu_0$, $\mu<\mu_0$ or $\mu>\mu_0$ depending on situation). Nature of hypothesis testing do not provide evidence for something, it does only against something, if it does.

$\endgroup$
4
  • $\begingroup$ "Now for what value of μ do we have evidence?" -- We have stronger evidence for values closer to sample mean and weaker evidence for values further from sample mean. How strong or weak depends on sample size and variance. Is there something wrong with this interpretation? $\endgroup$
    – bkoodaa
    Commented Apr 25, 2017 at 8:23
  • $\begingroup$ Yes this is a misinterpretation. P value is not probability of null hypothesis being true, or strength of evidence in favour of null hypothesis. Similarly, you could make an interval estimate, with sample mean in the middle of the interval, but this does not mean that there is a higher probability of population mean being close to middle of the interval. There is a reference to a good explanation about this misinterpretation in the comment by Dominic Comtois to your question. $\endgroup$
    – Macond
    Commented Apr 25, 2017 at 9:31
  • $\begingroup$ "this does not mean that there is a higher probability of population mean being close to middle of the interval." -- This can't be correct. I read the paper but could not find anything to corroborate this. $\endgroup$
    – bkoodaa
    Commented Apr 25, 2017 at 17:14
  • $\begingroup$ Middle of the confidence interval corresponds to $\mu$'s, which will yield the observed sample mean with higher probabilities. But this is not equavalent to the statement: "$\mu$'s closer to the middle have higher probability of being true mean". As stated many times by others: $P(A|B) \ne P(B|A)$. $\endgroup$
    – Macond
    Commented Apr 25, 2017 at 20:17
4
$\begingroup$

Consider the small dataset (illustrated below) with mean $\bar x \approx 0$, say that you conducted a two-tailed $t$-test with $H_0: \bar x = \mu$, where $\mu = -0.5$. The test appears to be insignificant with $p > 0.05$. Does that signify that your $H_0$ is true? What if you tested against $\mu = 0.5$? Since the $t$ distribution is symmetric, the test would return a similar $p$-value. So you have approximately the same amount of evidence that $\mu = -0.5$ and that $\mu = 0.5$.
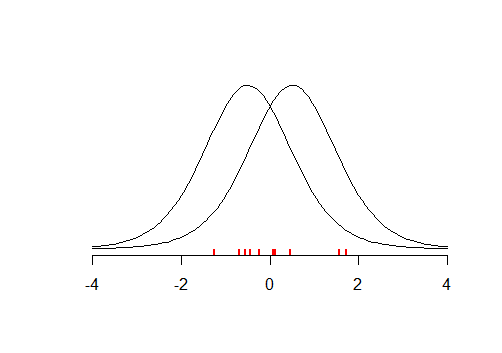
Two alternative hypotheses

The above example shows that small $p$-values lead us away from believing in $H_0$ and that high $p$-values suggest that our data is somehow more consistent with $H_0$, as compared to $H_1$. If you conducted many such tests, then you could find such $\mu$ that is most likely given our data and in fact you would be using semi-maximum likelihood estimation. The idea of MLE is that you seek for such value of $\mu$ that maximizes the probability of observing your data given $\mu$, what leads to likelihood function

$$ L(\mu | X) = f(X | \mu) $$

MLE is a valid way of finding the point estimate for $\hat\mu$, but it tells you nothing about probability of observing $\hat\mu$ given your data. What you did is you picked a single value for $\hat\mu$ and asked about probability of observing your data given it. As already noticed by others, $f(\mu|X) \ne f(X|\mu)$. To find $f(\mu|X)$ we would need to account for the fact that we tested against different candidate values for $\hat\mu$. This leads to Bayes theorem

$$ f(\mu|X) = \frac{ f(X|\mu) \, f(\mu) }{ \int \, f(X|\mu) \, f(\mu) \, d\mu } $$

that first, considers how likely are different $\mu$'s a priori (this can be uniform, what leads to results consistent with MLE) and second, normalizes for the fact that you considered different candidates for $\hat\mu$. Moreover, if you ask about $\mu$ in probabilistic terms, you need to consider it as a random variable, so this is another reason for adopting Bayesian approach.

Concluding, hypothesis test tells you if $H_1$ is more likely then $H_0$, but since the procedure needed you to assume that $H_0$ is true and to pick a specific value for it. To give an analogy, imagine that your test is an oracle. If you ask her, "the ground is wet, is it possible that it was raining?", she'll answer: "yes, it is possible, in 83% of cases when it was raining, the ground become wet". If you ask her again, "is it possible that someone just spilled the water on the ground?", she'll answer "sure, it is also possible, in 100% of cases when someone spilled water on the ground, it become wet", etc. If you ask her for for some numbers, she will give them to you, but the numbers would not be comparable. The problem is that the hypothesis test/oracle operates in a framework, where she can give conclusive answers only for the questions asking if the data is consistent with some hypothesis, not the other way around, since you are not considering other hypotheses.

$\endgroup$
3
$\begingroup$

Both null and alternative hypothesis are models, and as such different from reality and never true. A rejection of the null hypothesis says that the data are not compatible with the null hypothesis, because if the null hypothesis were true, such data would not normally be observed. A non-rejection of the null hypothesis says that the data are compatible with the null hypothesis, meaning that if data are generated from the null hypothesis, they could very well look like the data we have.

But all data is compatible with many models. For example, if our null hypothesis is ${\cal N}(0,1)$ and we observe data with mean 0.01 and sample variance 1.13, data are surely also compatible with a ${\cal N}(0.01,1.13)$ distribution (and all kinds of other distributions "in between"), even though they will (if the sample size is not excessively large) not reject ${\cal N}(0,1)$. Furthermore the data will be compatible with lots of non-normal models with similar expected values and variances, and with all kinds of distributions with dependence or non-identity structures that fit the data well as they are (including a crazy dependence structure that says that if we observe the first observation as it is, all else will happen as it happened with probability 1). In reality nothing is really identical and nothing is really independent, and for sure nothing is really normally distributed, so really the best we can say is that data are compatible with the $H_0$, which means that nobody claiming anything substantially different can use them as argument.

This issue by the way is not specific to tests and null hypotheses, and the only way Bayesian analysis can get around it is by going 100% subjective. Surely if a Bayesian says that the probability that model X is true is 87.5%, that's nonsense. The probability that any model is really true is zero. They are models and not reality after all.

$\endgroup$
2
$\begingroup$

Let's follow a simple example.

My null hypothesis is that my data follows a normal distribution. The alternative hypothesis is that the distribution for my data is not normal.

I draw two random samples from an uniform distribution on [0,1]. I can't do much with just two samples, thus I wouldn't be able to reject my null hypothesis.

Does that mean I can conclude my data follows normal distribution? No, it's an uniform distribution!!

The problem is I have made the normality assumption in my null hypothesis. Thus, I can't conclude my assumption is correct because I can't reject it.

$\endgroup$
3
  • 3
    $\begingroup$ I don't think a study with 2 samples qualifies as a "study". As soon as we draw a reasonable number of data points, this example doesn't work. If we draw 1000 data points and they look like a uniform distribution, we have evidence against our null hypothesis. If we draw 1000 data points and they look like a normal distribution, we have evidence for our null hypothesis. $\endgroup$
    – bkoodaa
    Commented Apr 25, 2017 at 6:51
  • 1
    $\begingroup$ @AtteJuvonen My answer is not an attempt to define what a study is supposed to be. I simply try to give a simple example to illustrate lack of statstical power for the question. We all know 2 samples is bad. $\endgroup$
    – SmallChess
    Commented Apr 25, 2017 at 7:00
  • 4
    $\begingroup$ Right. I'm just saying your example illustrates the problem of drawing conclusions from 2 samples. It doesn't illustrate the problem of drawing evidence for null hypothesis. $\endgroup$
    – bkoodaa
    Commented Apr 25, 2017 at 7:04
2
$\begingroup$

Rejecting $H_0$ requires your study to have enough statistical power. If you're able to reject $H_0$, you can say that you have gathered sufficient data to draw a conclusion.

On the other hand, not rejecting $H_0$ doesn't require any data at all, since it's assumed to be true by default. So, if your study doesn't reject $H_0$, it's impossible to tell which is more probable: $H_0$ is true, or your study simply wasn't large enough.

$\endgroup$
1
  • $\begingroup$ Having evidence for something is not the same thing as knowing something with 100% certainty. We do not need to "know whether $H_0$ is true". Even if we end up rejecting $H_0$ we still do not "know" whether $H_0$ is true. $\endgroup$
    – bkoodaa
    Commented Apr 26, 2017 at 16:12
0
$\begingroup$

No, it is not evidence unless you have evidence that it is evidence. I'm not trying to be cute, rather literal. You only have probability of seeing such data given your assumption the null is true. That is ALL you get from the p-value (if that, since the p-value is based on assumptions themselves).

Can you present a study that shows that for studies that "fail" to support the null hypothesis, a majority of the null hypotheses turn out to be true? If you can find THAT study, then your failure to disprove the null hypotheses at least reflects a VERY generalized likelihood that the null is true. I'm betting you don't have that study. Since you don't evidence relating to null hypotheses being true based on p-values, you just have to walk away empty-handed.

You started by assuming your null was true to get that p-value, so the p-value can tell you nothing about the null, only about the data. Think about that. It's a one-directional inference - period.

$\endgroup$

Not the answer you're looking for? Browse other questions tagged or ask your own question.