My answer/comments here (way too long for a SE comment ) don't and are not meant to respond to the particular question BUT as BACON once opined "To ask the proper question is half of knowing" . I am suggesting that the OP didn't ask what I think is the larger/proper question i.e. how to simulate/forecast future day's activity but rather focused on the issue of continuous vs discrete , a problem/opportunity in itself. Please don't downvote/criticize my response as not being pertinent to the question but rather being oriented to a bigger issue.
If you have 303 days of data and you want to predict/simulate tomorrow , why would you use the observed history for all 303. The answer is ..iF you assume that tomorrow is like every other day then you are good to go. What we find is that if you actually model arrivals as it relates to day-of-the-week , you can then get a conditional distribution for tomorrow reflecting the day-of-the-week using the residuals from a simple (perhaps toooo simple !) model. The residuals reflect the conditional distribution around the expected value for tomorrow and can be harvested to provide a monte-carlo distribution for tomorrow.
Now just a little bit more realistic. If there are unusual values (the source of your fat-tailed distribution ) they can be identified along with ant time trends, level shifts , day-of-the-month effects and of course memory effects to effectively construct a conditional distribution reflecting unknown/un-identified sources of variation. With a "richer model" we will be able to get a better expectation for tomorrow and the uncertainty in that expectation.
Now the good news is that if anomalies ( one-time pulses) have been detected and remedied to make a prediction ( N.B. all predictions are simulations and all simulations are predictions ..they are synonyms ) it is now possible (and correct) to enable the possibility of anomalies occurring in the next period.
If the next day is a Monday and no anomalies have been observed in the past on any Monday then pulses will b expected tomorrow BUT if previous Mondays have been effected then anomalies will be appropriately pro-rated.
I point you to to a reference that discusses the simulation/prediction of activity for the demand for daily cash cash.http://autobox.com/cms/index.php/afs-university/intro-to-forecasting/doc_download/53-capabilities-presentation slide 49 ..
In summary the statistical action is all about the residuals as they are equivalent to an adjusted observation incorporating factors that can reflect/explain identified variation e.g. holiday effects and even particular day-of-the-month effects
Incorporation of forecasting methods as a precursor to "simulation" is clearly on the horizon (so to speak !).
EDITED AFTER RECEIPT OF DATA:
At first glance your integer data looks very straight-forward BUT when you have time series data you need to have a complete set i.e. no missing dates so that calendar "features" can be detected. Please fill in all dates . The fact that your extraction didn't fill in 0's is typical of accounting systems. Secondly I suggest that you upvote my answer and accept it to close the current question and then open up a new question that is more honest and direct as compared to this question. Also request that forecasts need to be integers because only integers can arise.

EDITED AFTER RECEIPT OF DATA:
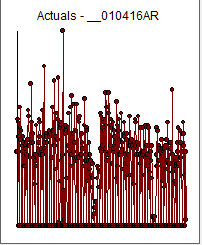
I took your first product (AR) and blank-filled the missing dates and obtained 443 daily historical values (1/4/16-3/21/17 )  . Since the series is short I disabled Holiday effects detection along with Monthly Indicators (although there was some evidence of this) and introduced the data to AUTOBOX , my tool of choice. If one were to naively simulate simply based on the histogram then one would draw samples from here
  essentially showing no discimination for the day being predicted/simualted. A more nuanced approach would be to model the data and partition historical variability to signal and noise with the noise being the conditional distribution as the basis for randomness/simulation
  . This is the histogram of errors from a model which used DAILY EFFECTS as a predictor while isolating exceptional values and a level shift. A summary of the descriptive statistics by day is here
Here is the Actual and Cleansed graph  and the Actual/Fit/Forecast graph
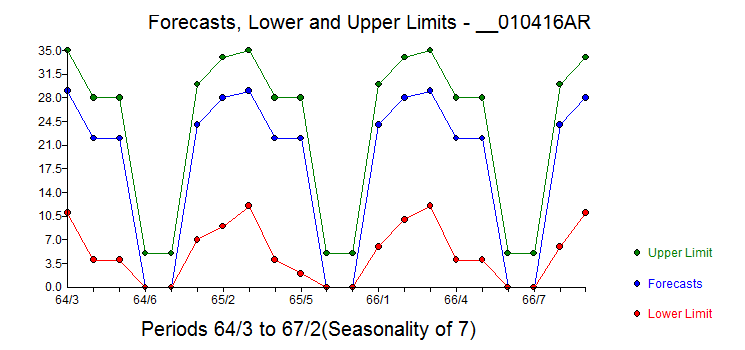
The equation is here  with Forecasts here the next 21 days (444-464)
  reflecting possible anomalies in the future.
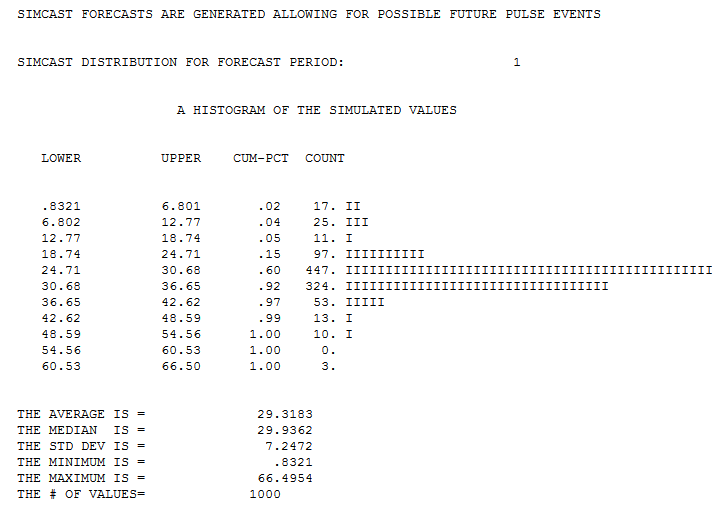
To illustrate , this is the forecast distribution/simulation for day 444 ( 1 period out ) 3/22/17 a Monday  while this is for day 445
  . So simulating the future requires a prediction for the future as all days are possibly different in their expectations and an estimate of the uncertainty(randomness) around that prediction . Forecasts are made and then integerized because all of the history is reported as integers . Here is a pix of the output showing history and projections


