1
$\begingroup$

"A reference interval is a type of prediction interval and contains the middle 95% of measurements of some substance or item from a healthy population. Age specific reference intervals provide variable interval limits based on age. An Age-Specific Reference Interval gives the boundaries between which a typical measurement on an individual of a certain age from a population of individuals is expected to fall. The reference interval is often presented as percentiles of a healthy reference population, such as the 2.5th percentile and the 97.5th percentile".

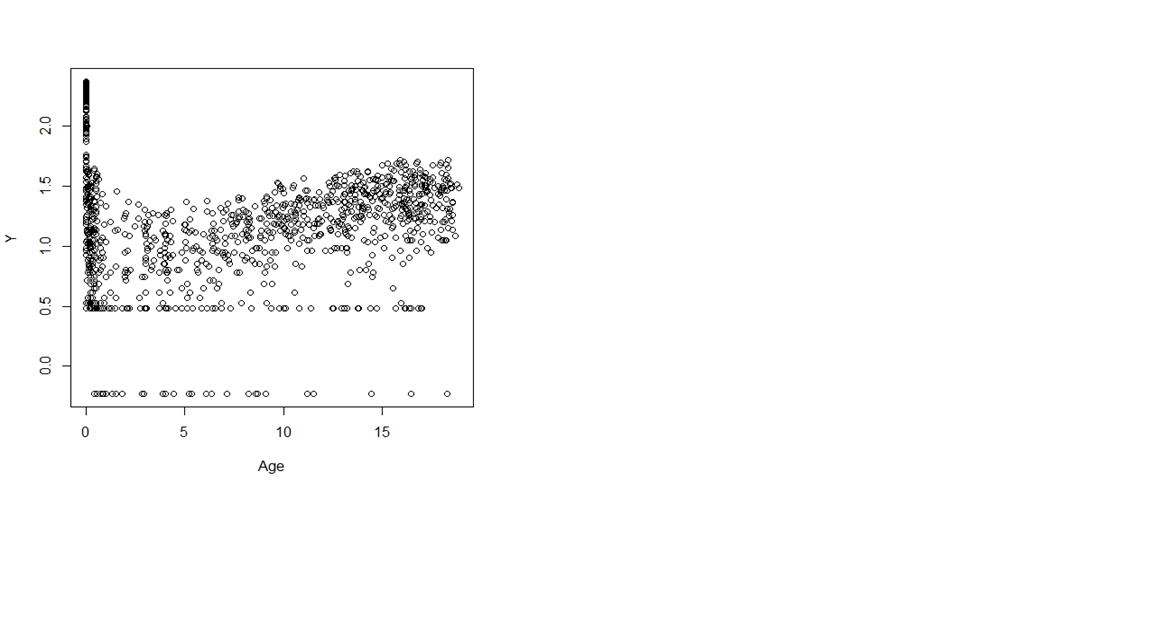
I have a dependent variable and variable Age as the independent variable. I want to apply the nonparametirc quantile regression for 0.025 and 0.975 quantiles and I have this shapeenter image description here.

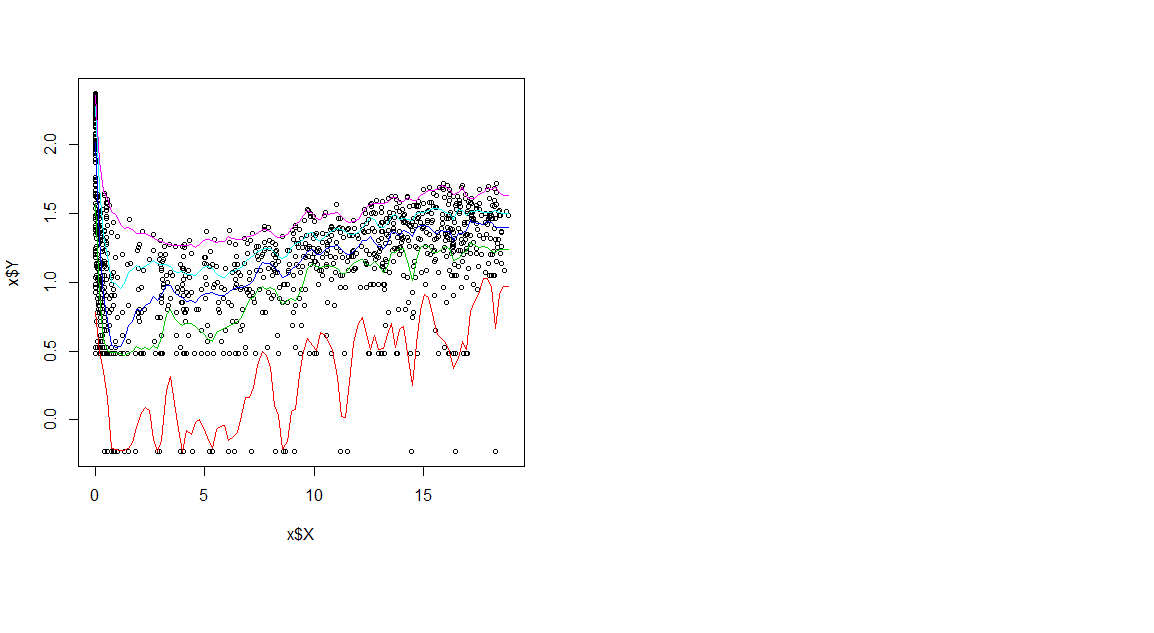
So I decided to use the power transformation method (calculated lambda=-0.37) for the dependent variable and work with the transformed variable.But I am not sure about the efficiency of this model to calculate the reference curve and the z score and predicted values. Should I remove the observations which are less than 0.5 in the second plot to have more smooth curve? What should I do when the nature of observation between 0 to one year old is completely different from 1 year to 19 years old?

enter image description here

enter image description here

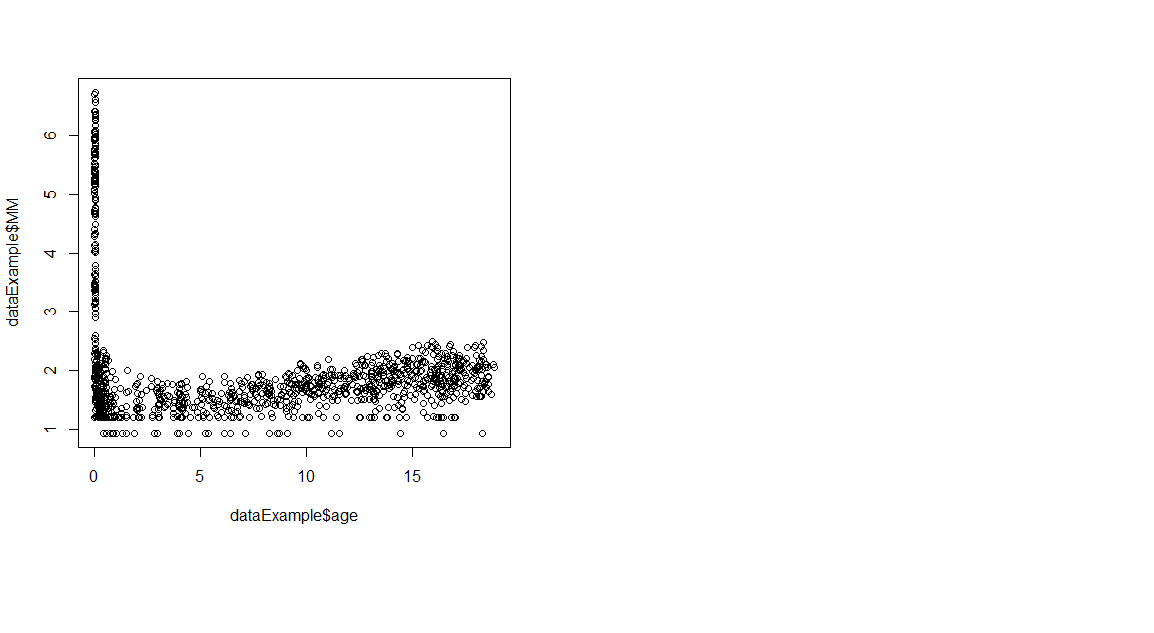
Also this is the plot after using cubic root transformation. enter image description here
$\endgroup$
6
  • $\begingroup$ What is the problem, exactly? Your quantile regression appears to have succeeded. $\endgroup$
    – whuber
    Commented Jan 18, 2018 at 15:45
  • $\begingroup$ You need a better title. It's not informative. Something like "Quantile regression with transformation of response" would work better. $\endgroup$
    – Nick Cox
    Commented Jan 18, 2018 at 16:18
  • $\begingroup$ @whuber, thanks for the reply. It means you think I use the transformation method in a correct way and also the method for applying the quantile curves is chosen correctly? $\endgroup$
    – shadi
    Commented Jan 18, 2018 at 17:16
  • $\begingroup$ @NickCox, thanks for the reply, I changed the title as you requested. I used power normal transformation and the calculated lambda is -0.37. Based on your advice I used the cube root (please see the final plot above). The nature of observation between 0 to 1 year is different from the rest of the observations. So any advice? I want to make the growth chart at 0.025 and 0.95 quantiles. The data set includes the information of kids from birth to 19 years old. Do you think that I should apply two different quantile regression for 0-1 year old and 1 year to 19 years old? $\endgroup$
    – shadi
    Commented Jan 18, 2018 at 17:18
  • 1
    $\begingroup$ I don't know whether your regression is "correct": see Nick Cox's answer. I am only pointing out that your question is unclear because it asks how to apply quantile regression, you applied it, and you got a result that is consistent with the data. There's no information to determine whether that is meaningful, appropriate, or correct for your purposes. $\endgroup$
    – whuber
    Commented Jan 18, 2018 at 17:33

1 Answer 1

1
$\begingroup$

There is little or no detail here on the substantive, scientific or practical context but the following general or specific problems seem to be biting here:

  • Calculating extreme percentiles requires an enormous sample size to work really well.

  • Regression here and elsewhere can be sensitive to granularity in the data. Your transformation is unsatisfactory as you've created outliers from your smallest values. At a guess you're using something like log$_{10}$ (response + 0.5), but that maps zeros to a value much less than the next lowest value. A transformation such as log$_{10}$ (response + 1) or cube root is likely to work better.

  • Whatever you're doing is not smoothing enough to make obvious sense as a solution. Does your smoothed curve make sense scientifically?

  • Whatever you're dealing with clearly varies most within the first year of life, so it's not obvious that a linear scale for age is appropriate.

$\endgroup$
2
  • $\begingroup$ thanks for the reply, I changed the title as you requested. I used power normal transformation and the calculated lambda is -0.37. Based on your advice I used the cube root (please see the final plot above). The nature of observation between 0 to 1 year is different from the rest of the observations. So any advice? I want to make the growth chart at 0.025 and 0.95 quantiles $\endgroup$
    – shadi
    Commented Jan 18, 2018 at 16:35
  • $\begingroup$ Cube roots do seem better than your previous transformation. I don't often find that Box-Cox (or whatever variant you're using) gives useful answers, despite the wonderful name and impressive theory. The answer to you question about age < and > 1 year I think requires specialist knowledge that I don't have. Even specialists would want to know what you're analysing. Your smoothed curves seem unacceptably erratic to this non-medic. $\endgroup$
    – Nick Cox
    Commented Jan 18, 2018 at 17:43

Your Answer

By clicking “Post Your Answer”, you agree to our terms of service and acknowledge you have read our privacy policy.

Not the answer you're looking for? Browse other questions tagged or ask your own question.