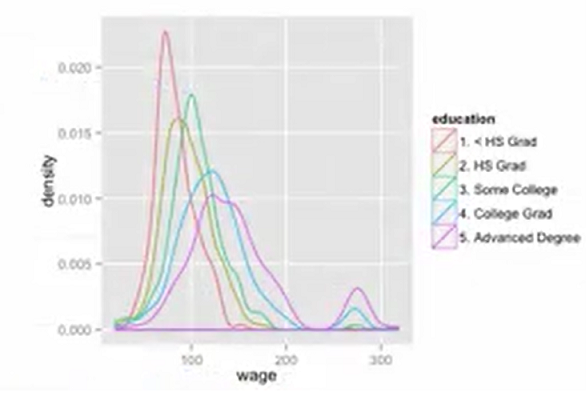
I have come across a picture of a density plot that I understand visually and conceptually but I am confused by the terminology. It is referred to as simply a "Density Plot". Have a look:
Question: If a researcher refers to a graph as a density plot, what does he/she probably mean?
Unfortunately I couldn't find the URL to accompany the picture, so we won't be able to examine everything under the hood. However, I'm hoping someone can tell what it most likely is just by glancing at it, or at least weigh in on what the conventional understanding of "Density Plot" implies.
If I'm not mistaken there are many types of densities plots. If I had to guess, judging by the smoothness, it is a kernel distribution of some sort. I did a bit of research and found out there are many types of kernel distributions: Epanechnikov, uniform, triangular, biweight, normal, and cosinus just to name a few.
Since there are so many out there, I'm wondering if we wouldn't have to specify which type of density is being plotted? Or is one type much more common than the other types, to the effect that "Density Plot" is assumed to mean that type and not any other type unless otherwise stated?

