First of all, I understand this isn't a strictly statistical question, but I've seen other questions involving optim() here. Please feel free to suggest a better SE subdomain for this if you know one.
The problem: I'm trying to recover latent components from a signal. The functional form of the components is assumed known, though the amount actually present could be anything from 2 to 5. There is also some noise.
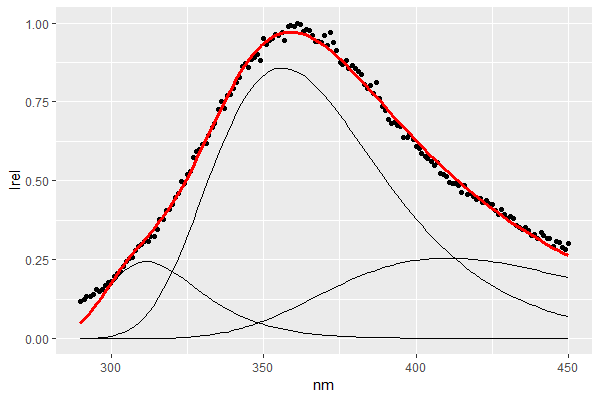
If I initialize the parameters near seemingly reasonable points, I get pretty good results:
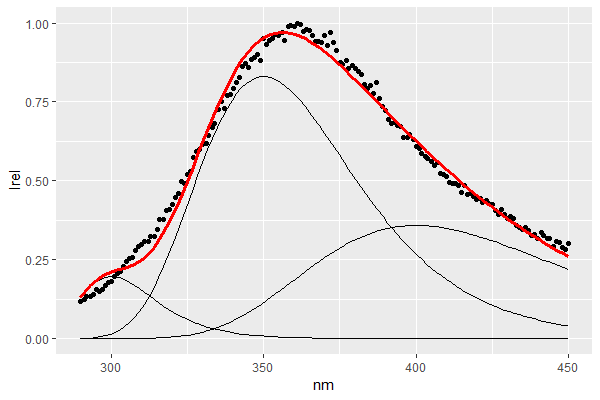
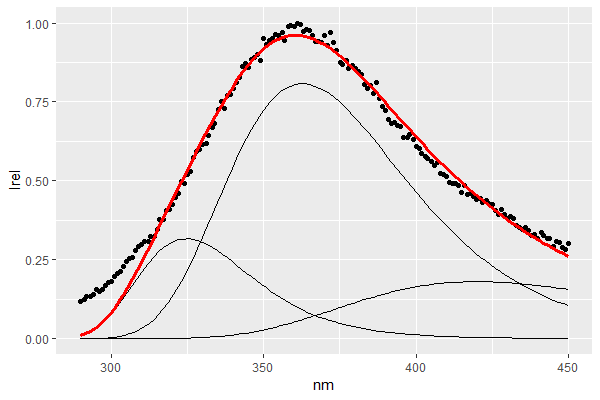
However, slight changes to the initial conditions ($\pm 10$ for starting position in the x-axis) make the optimization settle for clearly suboptimal fits:
The estimated parameters are obviously different:
            A           B           C           D           E           F
Good 0.2437936   0.8574553   0.2551376 311.4988629 356.2413314 410.4340460
Meh1 0.1968331   0.8300569   0.3587093 300.0033490 350.0018268 399.9951828
Meh2 0.3160437   0.8076175   0.1806510 324.6438328 362.8249570 420.1755116
I noticed that the final error size it settles for is also higher in the bad fits, so I figured that optimizing on the initial parameters to minimize the final error could work. But that seems a bit forced, so I was wondering if there's a more "natural" way to make the optimization routines explore the parameter space better.
Here's the code and the data I've used to get the estimates above:
# DATA
structure(list(nm = c(290, 291.0700073, 292, 293.0700073, 294,
                      295.0700073, 296, 297.0700073, 298, 299.0700073, 300, 301.0700073,
                      302, 303.0700073, 304, 305.0700073, 306, 307.0700073, 308, 309.0700073,
                      310, 310.9299927, 312.0299988, 312.9599915, 314.0599976, 315,
                      315.9299927, 317.0299988, 317.9599915, 319.0599976, 320, 321.0700073,
                      322, 323.0700073, 324, 325.0700073, 326, 327.0700073, 328, 329.0700073,
                      330, 331.0700073, 332, 333.0700073, 334, 335.0700073, 336, 337.0700073,
                      338, 339.0700073, 340, 341.0700073, 342, 343.0700073, 344, 345.0700073,
                      346, 347.0700073, 348, 349.0700073, 350, 351.0599976, 351.9599915,
                      353.0299988, 353.9299927, 355, 356.0599976, 356.9599915, 358.0299988,
                      358.9299927, 360, 361.0700073, 362, 363.0700073, 364, 365.0700073,
                      366, 367.0700073, 368, 369.0700073, 370, 371.0700073, 372, 373.0700073,
                      374, 375.0700073, 376, 377.0700073, 378, 379.0700073, 380, 381.0599976,
                      381.9599915, 383.0299988, 383.9299927, 385, 386.0599976, 386.9599915,
                      388.0299988, 388.9299927, 390, 391.0700073, 392, 393.0700073,
                      394, 395.0700073, 396, 397.0700073, 398, 399.0700073, 400, 401.0599976,
                      401.9599915, 403.0299988, 403.9299927, 405, 406.0599976, 406.9599915,
                      408.0299988, 408.9299927, 410, 411.0599976, 411.9599915, 413.0299988,
                      413.9299927, 415, 416.0599976, 416.9599915, 418.0299988, 418.9299927,
                      420, 421.0599976, 421.9599915, 423.0299988, 423.9299927, 425,
                      426.0599976, 426.9599915, 428.0299988, 428.9299927, 430, 431.0599976,
                      431.9599915, 433.0299988, 433.9299927, 435, 436.0599976, 436.9599915,
                      438.0299988, 438.9299927, 440, 441.0599976, 441.9599915, 443.0299988,
                      443.9299927, 445, 446.0599976, 446.9599915, 448.0299988, 448.9299927,
                      450),
               Irel = c(0.117806361618286, 0.124055360135408, 0.132286087317653,
               0.134765173276003, 0.141416137595884, 0.154651050395524, 0.150792836007325,
               0.1564751297397, 0.168489707784141, 0.179055956196472, 0.182165493262127,
               0.197649148327743, 0.205262794893577, 0.214227392088028, 0.229183782751442,
               0.244643054198938, 0.253658311323034, 0.256158450913007, 0.279918545689736,
               0.292411259981127, 0.298011575703029, 0.30800050219483, 0.308153514083128,
               0.324290067808231, 0.323991856500551, 0.34613575945743, 0.376828983513388,
               0.376172574407897, 0.405651374778084, 0.409478976390944, 0.42516737006287,
               0.447803209783957, 0.459725364616002, 0.497083173184919, 0.492693254698212,
               0.521438933418449, 0.528993505602943, 0.574070496055267, 0.592562867551184,
               0.599977161734153, 0.616551241235139, 0.618316074083678, 0.642397163265336,
               0.670244422495287, 0.681992262150335, 0.726539768487631, 0.750815856559603,
               0.728690744532417, 0.76931865595805, 0.77320961687876, 0.793517997428088,
               0.81044222137464, 0.826698988737789, 0.863562451258101, 0.871270035330893,
               0.858135039696234, 0.885867075272038, 0.890256099017011, 0.899116950151812,
               0.882963567297772, 0.952403820552076, 0.930567111505424, 0.944340792149357,
               0.949783209073671, 0.964888292257969, 0.962151218200197, 0.97105811774725,
               0.946144789965987, 0.988312112100969, 0.991161862945315, 0.9892146960761,
               1, 0.994246259414727, 0.972130508456595, 0.978568637828816, 0.977238543005258,
               0.95938736887762, 0.94203322502379, 0.941573570009061, 0.938253426572537,
               0.961694178844629, 0.92750240070744, 0.970346815661228, 0.939917490571128,
               0.912161501764443, 0.875776829146493, 0.870000856247766, 0.88240348761658,
               0.855000878264457, 0.865616375454144, 0.856034172797298, 0.845213007931437,
               0.836370190342225, 0.805299908541629, 0.791224127722616, 0.80136338142642,
               0.777883739578135, 0.810225747103884, 0.759593422057342, 0.73576225902955,
               0.723087606776591, 0.695577001172421, 0.682645332946674, 0.685600739775804,
               0.676688609135976, 0.671682788737244, 0.63731514682292, 0.639013144471281,
               0.647606104698215, 0.630829936713537, 0.608760302508152, 0.601968449272337,
               0.587685348651311, 0.57670249919507, 0.572182283125727, 0.56294110495427,
               0.550330809825504, 0.5585902481355, 0.522153539305056, 0.520661484724767,
               0.512877842191466, 0.495941090958452, 0.491016801221881, 0.491587618480521,
               0.483935099480003, 0.462098149550021, 0.486031457936156, 0.458126587217451,
               0.459458678124788, 0.451513936067923, 0.442474536479693, 0.444839784336694,
               0.431150387371712, 0.439101530654984, 0.427179134939608, 0.423819551143095,
               0.407499562280818, 0.394993443102741, 0.409101161713293, 0.394138731306351,
               0.380156423143598, 0.388180217786638, 0.380508185206435, 0.358726368914768,
               0.351223557776416, 0.345344888510005, 0.350888556050928, 0.34390456046729,
               0.328386696405115, 0.33055680756308, 0.315991257929834, 0.336901601862216,
               0.328079743378219, 0.3185103779083, 0.318298687246679, 0.292512613897891,
               0.307027159643554, 0.30604015418075, 0.290402867922108, 0.282963484657648,
               0.300103460224965)), class = "data.frame", row.names = c(NA, -161L)) -> ds

# TARGET FUNCTION
Im <- function(v,ivm,inv=F){
  if(inv){v<-(10^7)/v;ivm<-(10^7)/ivm}
  vneg <- 1.177*ivm - 7780
  vpos <- 0.831*ivm + 7070
  ir <- (ivm - vneg)/(vpos - ivm)
  ia <- ivm + ir*(vpos - vneg)/(ir^2 - 1)
  exp(-log(2)*(log(ia - v)-log(ia - ivm))^2/(log(ir)^2))
}
estI01 <- function(pars,refd){
  n <- length(pars)/2
  outer(refd$nm, pars[n+1:n], Im, inv=T) -> Im.j
  Im.j%*%pars[1:n] -> Iest
  return(mean(abs(refd$Irel - Iest)))
}

# OPTIMIZATION CONFIG
c(rep(0,3),rep(290,3)) -> lowb
c(rep(1,3),rep(450,3)) -> uppb
list(maxit=10**4) -> conl

# EXAMPLES
initp <- c(rep(0.5,3),300,350,400)

optim(par=initp,estI01,refd=ds,
      method="L-BFGS-B",
      lower=lowb,
      upper=uppb,
      control=conl) -> res1

initp <- c(rep(0.5,3),310,360,410)

optim(par=initp,estI01,refd=ds,
      method="L-BFGS-B",
      lower=lowb,
      upper=uppb,
      control=conl) -> res2

initp <- c(rep(0.5,3),320,370,420)

optim(par=initp,estI01,refd=ds,
      method="L-BFGS-B",
      lower=lowb,
      upper=uppb,
      control=conl) -> res3


rstanI managed to get a good and stable fit, so I suppose that settles it for now. $\endgroup$