I have a database of workers, customers, and jobs, and I want to analyze my data to see if a given worker is performing well above or below the mean. I've come up with something of a solution, and I'm interested in hearing if there are any flaws in my current approach.
My goal is to see if a given worker has a lower than average score when it comes to converting first-time jobs into recurring jobs.
I do this by taking all first-time jobs that a given worker has been assigned to, and I then check to see if any subsequent jobs exist under the same customer. If there were subsequent jobs the worker gets a 1, otherwise they get a 0. This gives me something that looks like this:
Worker 1 [48 total records (first-time jobs)]
0, 0, 0, 1, 0, 0, 1, 0, 1, 0, 1, 0, 0, 0, 1, 1, 1, 0, 1, 0, 0, 1, 0, 1, 1, 1, 1, 1, 1, 0, 0, 1, 0, 1, 1, 0, 0, 0, 0, 1, 1, 0, 0, 1, 0, 1, 1, 1,
--
Worker 2 [56 total records (first-time jobs)]
1, 1, 0, 1, 1, 1, 1, 1, 1, 1, 1, 0, 1, 1, 1, 1, 1, 1, 1, 0, 0, 0, 1, 0, 1, 1, 1, 0, 1, 1, 1, 1, 1, 1, 1, 1, 1, 1, 1, 0, 1, 0, 0, 0, 0, 0, 0, 0, 1, 0, 1, 1, 1, 1, 0, 1,
I then take this data and calculate the mean. I do this by counting the total number of first-time jobs in my system (2,925), as well as the sum of the 1's and 0's. This gives me a mean of 0.38 (so 38% of all first-time jobs typically become recurring jobs). I then calculate the standard deviation, which in this case is 0.13.
I then look at each worker who has completed a minimum of 15 first-time jobs. This is so that I only analyze workers with a sufficiently large sample size, in order to increase confidence in the results.
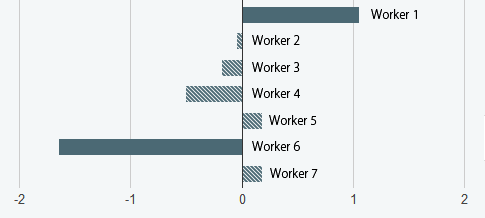
I then come up with a mean score for each of these workers (the sum of the 1's and 0's, divided by the total number of first-time jobs). Finally, I convert this into a z score, which I do by subtracting the mean (for all the data) from the worker's mean score. I then divide the result by the standard deviation to obtain the individual z score. Finally, I put the results in a bar chart, which looks like this:

The dark bars are for any result with a z-score above 1 or below -1.
My questions are as follows:
- Is this the correct approach, given my goals?
- Does it make sense to limit this analysis to workers with a minimum of 15 records? The lower the threshold, the sooner I can perform this valuable analysis, but I want to make sure I'm using a large enough sample size to avoid problems.
- If 15 is a good minimum, should I also use that as the maximum? For example, if Worker 1 has 15 records, and Worker 2 has 35 records, should I only analyze the last 15 of Worker 2's records? Or is it better to include all the data available?
- Finally, what z-scores should I consider significant? Right now I am focusing on anything greater than 1, but is that too low?
I greatly appreciate any input. Thank you.
