3
$\begingroup$

We can approximate the log likelihood at the real parameter value $l(\theta)$ with the MLE estimate $l(\hat\theta)$ using second order Taylor polynomials, like so:

$$l(\theta) - l(\hat\theta) \approx -\frac 1 2I(\hat\theta)(\theta - \hat\theta)^2$$

where $I(\hat\theta)$ is the observed Fisher information. It is always positive, as is the square term that follows. This implies that this difference in logs is negative. How can that be? This says that the log likelihood is higher under the MLE estimate than the true parameter value - shouldn't the truth be the highest attainable likelihood?

$\endgroup$
4
  • $\begingroup$ Where is the first order tern? $\endgroup$
    – user158565
    Commented Nov 2, 2018 at 4:09
  • $\begingroup$ It's expected value is zero so it's not there. $\endgroup$
    – badmax
    Commented Nov 2, 2018 at 4:16
  • $\begingroup$ Then should be $l(\theta)-\mathrm{E}(l(\hat\theta)) = -\frac12 ...$ $\endgroup$
    – user158565
    Commented Nov 2, 2018 at 4:18
  • $\begingroup$ since $\hat\theta$ is the MLE, $\ell(\hat\theta)\ge\ell(\theta)$ $\endgroup$
    – Xi'an
    Commented Nov 2, 2018 at 4:46

1 Answer 1

2
$\begingroup$

No. Keep in mind that the likelihood function you're dealing with will be different for every sample. The highest attainable likelihood (under some model) is the one you get when you maximize it for a given sample; the truth should be near that identified maximum* but with continuous parameters it will never be greater and will (almost) always be smaller. (If it were ever greater it means you didn't maximize the likelihood!)

* at least in value of the log-likelihood (and in sufficiently nice cases, in argument)

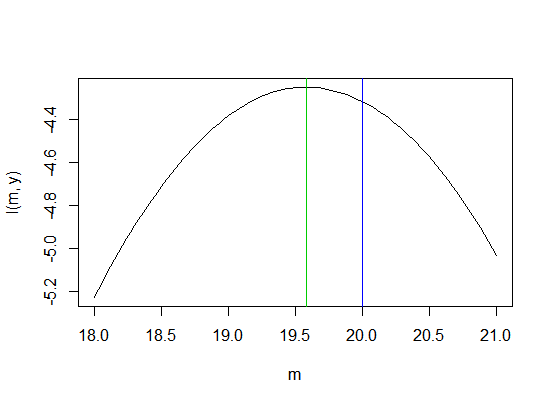
Consider a specific example. Let's generate a set of data from a normal distribution with mean 20 and standard deviation 3 (n=7 observations):

24.50 20.28 15.36 20.67 21.87 14.35 20.06

for simplicity, let's also assume we know $\sigma=3$, and look at the likelihood as a function of $\mu$.

The log likelihood will be maximized at $\mu=\bar{x}$ not at $\mu=20$; that's because $\bar{x}$ minimizes the sums of squared deviations from the observations you have, so it maximizes the likelihood for those data.

Plot of normal likelihood with known sigma

$\endgroup$

Your Answer

By clicking “Post Your Answer”, you agree to our terms of service and acknowledge you have read our privacy policy.

Not the answer you're looking for? Browse other questions tagged or ask your own question.