1
$\begingroup$

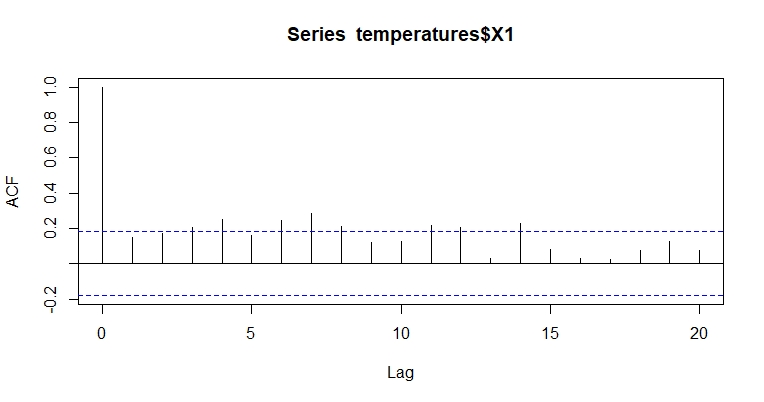
We want to apply extreme value theory to the maximum yearly temperatures. Before we choose the model we want to test whether or not we can assume independence. First we made a plot of the autocorrelation function:

acf plot

Thereafter, we applied the Ljung-Box and/or Box-Pierce test. However we find that if we only include one lag, there is no statistical evidence of dependence on the 5% level (our p-value is about 0.1) but if we include 2 or more lags, the p-values are significantly lower than our significance level. Can anyone help us understand what we can conclude from these results?

$\endgroup$

3 Answers 3

2
$\begingroup$

It is difficult to answer your question without actually looking into the data not just reflecting on summary statistics like the acf/pacf. To correctly use and understand a statistical test one has to know the assumptions underlying the test ( see A. Wald https://medium.com/@penguinpress/an-excerpt-from-how-not-to-be-wrong-by-jordan-ellenberg-664e708cfc3d !) . The two tests that you mentioned both requite that the process under evaluation does not have any Pulses, Level/step shifts , seasonal pulses and.or local time trends. Furthermore the process needs to have a constant error process over time.

If you post one of your examples I will try and help. If your data is confidential then I might be able to help offline.

$\endgroup$
0
$\begingroup$

Please note that LB test has following hypotheses:

H0 : The model does not exhibit lack of fit.

Ha: The model exhibits lack of fit.

So, significance level higher is better here (has to be >0.05 at least).

Read more from: https://www.itl.nist.gov/div898/handbook/pmc/section4/pmc4481.htm

$\endgroup$
0
$\begingroup$

A problem is that you're running multiple (at least two) tests here, and the more tests you run, the more likely is it to have a meaningless rejection of a null hypothesis. So in the first place I'd be interested in the precise p-value of the second test, and if this is just below 0.05, I wouldn't interpret this as clear evidence against independence.

Anyway your plot suggests that there might be weak long range dependence (or let's say moderately long range). There isn't any "contradiction" in your results as it may well be that you need to look at lags larger than one to find this. To what extent this will affect your further analysis I can't tell. It may not be that much of a problem, but then this depends on what exactly you want to do.

Note that there is a general misunderstanding about model assumptions. Models are by their very nature idealisations, and model assumptions will never hold precisely. What is important is whether models are violated in ways that mislead the later analysis you want to run. Unfortunately running model misspecification tests as you do here isn't always reliable for addressing this issue. Also note that not rejecting a model assumption does not mean it's true. Particularly Ljung-Box itself could be affected by outliers, so you should look at your actual data to see whether there might be a problem there.
$\endgroup$

Your Answer

By clicking “Post Your Answer”, you agree to our terms of service and acknowledge you have read our privacy policy.

Not the answer you're looking for? Browse other questions tagged or ask your own question.