0
$\begingroup$

I want to analyze the association between a binary variable and a continuous variable in R. But I am not clear about what steps I should follow.

I explored the continuous variable by the histogram and got the result that is normally distributed. Then I tried to use the linear regression model with lm(y~x, data), but the assumptions weren't met by the diagnostic plots. After that, I tried the logistic regression model with glm( y~x, data, family = binomial) but got a not significant p-value of the model. I don't know if the steps I did is correct or not since these two variables should relate to each other, and I don't know how to summarize and interpret my procedure and result.

I was wondering if I was doing right for this analysis. Could anyone show me a direction of any other way I could try?

$\endgroup$
1
  • 1
    $\begingroup$ y the outcome is binary and x the predictor is continuous. $\endgroup$
    – Eileen
    Commented Aug 8, 2019 at 20:01

2 Answers 2

2
$\begingroup$

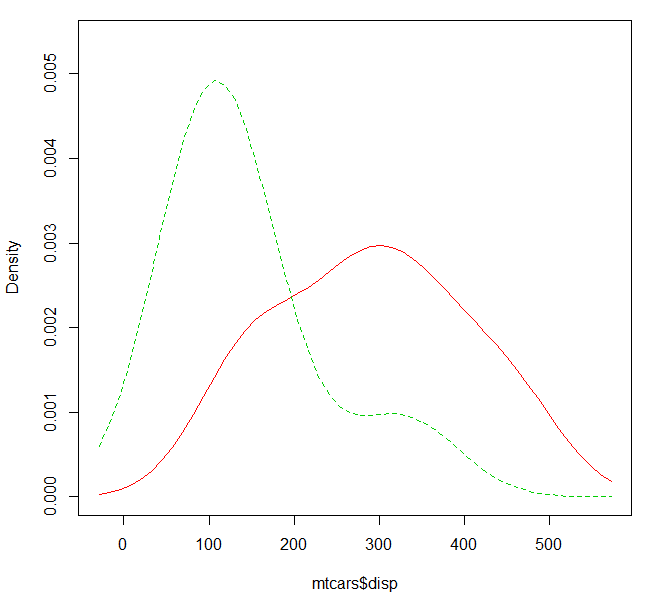
You do not provide any data so I will use the built-in mtcars data where am is the binary variable and disp is the continuous variable.

If you just want to "analyze the association between" the variables, some options are

 aggregate(mtcars$disp, list(mtcars$am), mean)
  Group.1        x
1       0 290.3789
2       1 143.5308

and

library(sm) 
sm.density.compare(mtcars$disp, mtcars$am)

Density plot

If you want to predict the binary variable, I would recommend rpart

library(rpart)
rpart(am ~ disp, data=mtcars)
n= 32 

node), split, n, deviance, yval
      * denotes terminal node

1) root 32 7.718750 0.4062500  
  2) disp>=163.8 18 1.777778 0.1111111 *
  3) disp< 163.8 14 2.357143 0.7857143 *
$\endgroup$
0
$\begingroup$

You should not give up on logistic regression. It might very well be that the log-odds of the binary outcome variable is not linear in the predictor $x$, but then you can try to represent the predictor via regression splines. There are many examples on this site, for instance How to achieve linear relationship between predictors and logit of outcome? or Are splines overfitting the data?.

After fitting the model look into some model diagnostics, see Interpreting residual diagnostic plots for glm models?.

If you post [a link to] your data I could have a look.

$\endgroup$

Your Answer

By clicking “Post Your Answer”, you agree to our terms of service and acknowledge you have read our privacy policy.