7
$\begingroup$

For example, we want to use age and IQ to predict GPA.

Of course we can do a multiple linear regression, i.e. regress GPA on age and IQ.

My question is: can we do two simple regressions instead? First, regress GPA on age and discuss the relationship between GPA and age. Then, regress GPA on IQ and discuss the relationship between GPA and IQ.

I understand if IQ and age are uncorrelated, they are essentially the same. What if IQ and age are slightly correlated in practice? Which method is better? Fundamentally what's the difference between these two methods?

$\endgroup$
1
  • $\begingroup$ Thanks. If age will indeed affect GPA, then age is actually included in the error term in the regression function of GPA on IQ, right? Similarly, IQ is included in the error term in the regression function of GPA on age. Then, we are actually doing two multiple regressions not simple regressions? I'm confused. $\endgroup$
    – damai
    Commented Aug 15, 2019 at 1:01

5 Answers 5

7
$\begingroup$

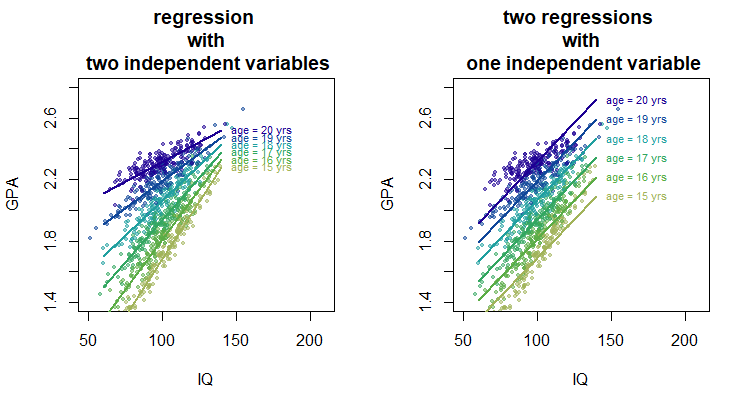
Note at first I understood your question as 'making multiple regressions with one variable' this gives rise to part 1 in which I explain the effect of an interaction term. In the image of part one the left image relates to doing six different simple regressions (a different one for each single age class, resulting in six lines with different slope).

But in hindsight it seems like your question is more relating to 'two simple regressions versus one multiple regression'. While the interaction effect might play a role there as well (because single simple regression does not allow you to include the interaction term while multiple regression does) the effects that are more commonly relating to it (the correlation between the regressors) are described in part 2 and 3.

1 Difference due to interaction term

Below is a sketch of a hypothetical relationship for GPA as function of age and IQ. Added to this are the fitted lines for the two different situations.

  • Right image: If you add together the effects of two single simple linear regressions (with one independent variable each) then you can see this as obtaining a relationship for 1) the slope of GPA as function of IQ and 2) the slope of GPA as function of age. Together this relates to the curves of the one relation shifting up or down as function of the other independent parameter.

  • Left image: However, when you do a regression with the two independent variables at once then the model may also takes into account a variation of the slope as a function of both age and IQ (when an interaction term is included).

For instance in the hypothetical case below the increase of GPA as function of increase in IQ is not the same for each age and the effect of IQ is stronger at lower age than at higher age.
example

2 Difference due to correlation

What if IQ and age are slightly correlated in practice?

The above explains the difference based on the consideration of the additional interaction term.

When IQ and age are correlated then the single regressions with IQ and age will partly measure effects of each other and this will be be counted twice when you add the effects together.

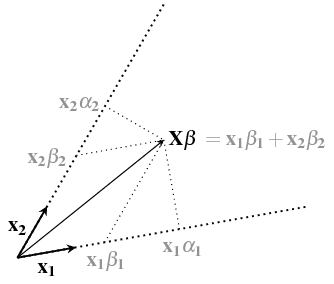
You can consider single regression as perpendicular projection on the regressor vectors, but multiple regression will project on the span of vectors and use skew coordinates. See https://stats.stackexchange.com/a/124892/164061

The difference between multiple regression and single linear regressions can be seen as adding the additional transformation $(X^TX)^{-1}$.

  • Single linear regression

$$\hat \alpha = X^T Y$$

which is just the correlation (when scaled by the variance of each column in $X$) between the outcome $Y$ and the regressors $X$

  • Multiple linear regression

$$\hat \beta = (X^TX)^{-1} X^T Y$$

which includes a term $(X^TX)^{-1}$ which can be seen as transformation of coordinates to undue the effect of counting an overlap of the effects multiple times.

See more here: https://stats.stackexchange.com/a/364566/164061 where the image below is explained
example

With single linear regression you use the effects $\alpha$ (based on perpendicular projections) while you should be using the effects $\beta$ (which incorporates the fact that the two effects of GPA and age might overlap)

3 Difference due to unbalanced design

The effect of correlation is particular clear when the experimental design is not balanced and the independent variables correlate. In this case you can have effects like Simpson's paradox.


Code for the first image:

layout(matrix(1:2,1))

# sample of 1k people with different ages and IQ
IQ <- rnorm(10^3,100,15)
age <- sample(15:20,10^3,replace=TRUE)

# hypothetical model for GPA
set.seed(1)
GPA_offset <- 2
IQ_slope <- 1/100
age_slope <- 1/8
interaction <- -1/500
noise <- rnorm(10^3,0,0.05)

GPA <- GPA_offset + 
       IQ_slope * (IQ-100) + 
       age_slope * (age - 17.5) + 
       interaction * (IQ-100) * (age - 17.5) +
       noise

# plotting with fitted models


cols <- hsv(0.2+c(0:5)/10,0.5+c(0:5)/10,0.7-c(0:5)/40,0.5)
cols2 <- hsv(0.2+c(0:5)/10,0.5+c(0:5)/10,0.7-c(0:5)/40,1)
plot(IQ,GPA,
     col = cols[age-14], bg = cols[age-14], pch = 21, cex=0.5,
     xlim = c(50,210), ylim = c(1.4,2.8))

mod <- lm(GPA ~ IQ*age)

for (i in c(15:20)) {
  xIQ <- c(60,140)
  yGPA <- coef(mod)[1] + coef(mod)[3] * i + (coef(mod)[2] + coef(mod)[4] * i) * xIQ
  lines(xIQ, yGPA,col=cols2[i-14],lwd = 2)
  text(xIQ[2], yGPA[2], paste0("age = ", i, " yrs"), pos=4, col=cols2[i-14],cex=0.7)
}
title("regression \n with \n two independent variables")


cols <- hsv(0.2+c(0:5)/10,0.5+c(0:5)/10,0.7-c(0:5)/40,0.5)
plot(IQ,GPA,
     col = cols[age-14], bg = cols[age-14], pch = 21, cex=0.5,
     xlim = c(50,210), ylim = c(1.4,2.8))

mod <- lm(GPA ~ IQ+age)

for (i in c(15:20)) {
  xIQ <- c(60,140)
  yGPA <- coef(mod)[1] + coef(mod)[3] * i + (coef(mod)[2] ) * xIQ
  lines(xIQ, yGPA,col=cols2[i-14],lwd = 2)
  text(xIQ[2], yGPA[2], paste0("age = ", i, " yrs"), pos=4, col=cols2[i-14],cex=0.7)
}

title("two regressions \n with \n one independent variable")
$\endgroup$
6
  • $\begingroup$ @carlo I have changed it accordingly by splitting up the question and making the first part more explicitly about the interaction term. $\endgroup$ Commented Oct 25, 2019 at 11:32
  • $\begingroup$ that's better. but it work's because the two predictors are independent. it wouldn't work otherwise, and correlation between covariates are the main reason to use multiple regression in the first place. actually, I think that's not a good idea to introduce interaction to someone who still doesn't understand difference between simple and multiple regression $\endgroup$
    – carlo
    Commented Oct 25, 2019 at 11:37
  • $\begingroup$ I just saw your last edit. way better, I would put the first part in the end and avoid to compare multiple regression with interaction with simple regressions (use multiple regression w/out interaction instead). I'm deleting my first comment. $\endgroup$
    – carlo
    Commented Oct 25, 2019 at 11:40
  • $\begingroup$ @Carlo the reason that I started to think about the interaction term is because of the title "regression with multiple independent variables vs multiple regressions with one independent variable" which I associated with making multiple regression lines. That's what I did in the code it is actually six times a single regression line. The effort has gone too far too change it back now, but I will add an extra clarification. $\endgroup$ Commented Oct 25, 2019 at 11:41
  • $\begingroup$ I don't understand the "six times a single regression line" part. what of the two plots are you talking about? $\endgroup$
    – carlo
    Commented Oct 25, 2019 at 11:45
6
+200
$\begingroup$

To explain a little more. Multiple regression tests for the unique contribution of each predictor. So let's take your example and assume that IQ and age are correlated.

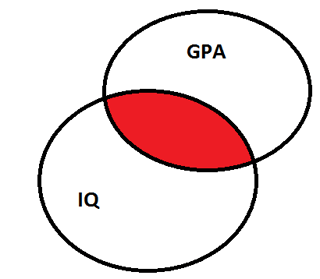
If you run a regression with IQ only the contribution of IQ can be visualized like this (red part):

enter image description here

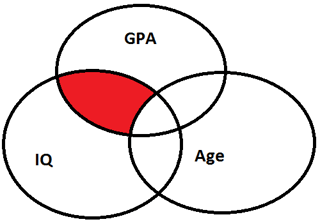
But once you add age to the analysis, it looks something like that:

enter image description here

As you can see the unique contribution (red part) of IQ is smaller, hence beta for IQ will dicrease in this analysis.

I hope this makes it clear why both analysis answer different question: First analysis, using only IQ as the predictor, tells you how much IQ contributes to predict GPA in total, while in the second analysis you can see the unique contribution of IQ to explain variation in GPA apart from age.

Keep in mind, that this is a simple exmaple and there can be other things going on like moderation, mediation or suppression which can change your interpretation of the results.

$\endgroup$
3
  • $\begingroup$ Sorry, but I do not know how to change size of images. $\endgroup$
    – user248711
    Commented Aug 14, 2019 at 11:16
  • $\begingroup$ Thanks. If age will indeed affect GPA, then age is actually included in the error term in the regression function of GPA on IQ, right? Similarly, IQ is included in the error term in the regression function of GPA on age. Then, we are actually doing two multiple regressions not simple regressions? I'm confused. $\endgroup$
    – damai
    Commented Aug 14, 2019 at 13:43
  • $\begingroup$ this is a little misleading because the red area of the second graph doesn't really represent anything in multiple regression (what is the middle region instead?) $\endgroup$
    – carlo
    Commented Oct 25, 2019 at 10:41
1
$\begingroup$

You can do that. It answers a different question.

If you include both independent variables then the results for each are controlling for the other. If you do them separately then they are not.

$\endgroup$
1
$\begingroup$

What this would do is answer drastically different questions.

  • Multiple regressions of one independent variable will give you an understand of the target variable varies with each output of each variable
  • A regression with multiple independent variables would give you coefficient estimates that let you know how the target variable varies for a given change in the independent variable - controlling for the other independent variables in the regression.

In the first case you would not be taking into account the impact of certain factors such as wealth, gender, ... into account when looking at at the age coefficient on IQ.

If for example, there is a disproportionate number of wealthy young people, that can have access to better education, better nutrients ... that will be implicitly absorbed in your "age" coefficient of your 1 independent regression variable. The regression might show that young people are "smarter", which might be true given your dataset, but the underlying factor might be attributable to wealth instead.

$\endgroup$
0
$\begingroup$

Your question says "Which method is better?". Better what for? If you want to predict GPA you might want to use both variables. If your question is about the relation between IQ and GPA, then you have no reason to add age to the Model. Hence, it depends on your research question what Model suits better. One point that appears unmentioned, is that not only beta but also the p values can change after addition of another predictor, leading to another interpretation of the results.

$\endgroup$

Your Answer

By clicking “Post Your Answer”, you agree to our terms of service and acknowledge you have read our privacy policy.

Not the answer you're looking for? Browse other questions tagged or ask your own question.