0
$\begingroup$

I have approximately 20 median values (overall survival in months) which were obtained from different populations groups (but they shared similar characteristics). Each population group has a unique size (e.g. 52 patients) and a corresponding median overall survival. I do not have individual patient level data.

I would like to obtain a value which best represents a measure of central tendency for patients with this characteristics across all populations. I wanted to know if doing a weighted average of medians would be my best option (each median is weighted by its corresponding number of patients). Additionally, I am wondering if it is possible to calculate a 95% CI and what method would best be used?

Thank you!

$\endgroup$

1 Answer 1

1
$\begingroup$

The weighted average and weighted median would each be appropriate in some situations, but you'd need assumptions about the distributions to get any confidence interval.

As an example, suppose you want the median survival time among 30 people, where you know:

  • The group of twenty men has median survival of $10$ months
  • The group of ten women has median survival of $8$ months

Here:

  • The weighted average of twenty $10$'s and ten $8$'s gives $9.33$. This is a good summary if the differences within groups are much greater than the differences between groups -- e.g. if survival varies a lot for both sexes, and sex is mostly irrelevant.
  • The weighted median of twenty $10$'s and ten $8$'s gives $10.00$. This is a good summary if the differences between groups are much greater than the differences within groups -- e.g. if survival depends heavily on sex and not much else matters.

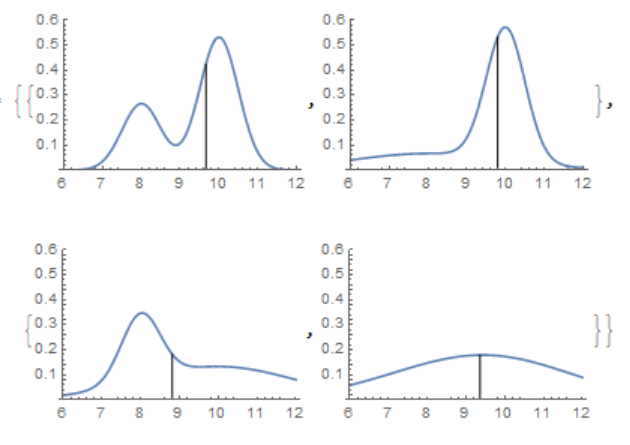
Here is a table showing different medians for the combined group given normal distributions for the subgroups with different standard deviations:

\begin{array}{c|ccc} \ & \ & \sigma_w \\ \sigma_m & 1/2 & 1 & 2 \\ \hline 1/2 & 9.66 & 9.70 & 9.80 \\ 1 & 9.33 & 9.44 & 9.63 \\ 2 & 8.81 & 9.07 & 9.36 \\ \end{array}

And here is a graphic from Mathematica showing the distributions and their medians for the four corner cases in the table: enter image description here This shows the variety of possibilities.

$\endgroup$

Your Answer

By clicking “Post Your Answer”, you agree to our terms of service and acknowledge you have read our privacy policy.

Not the answer you're looking for? Browse other questions tagged or ask your own question.