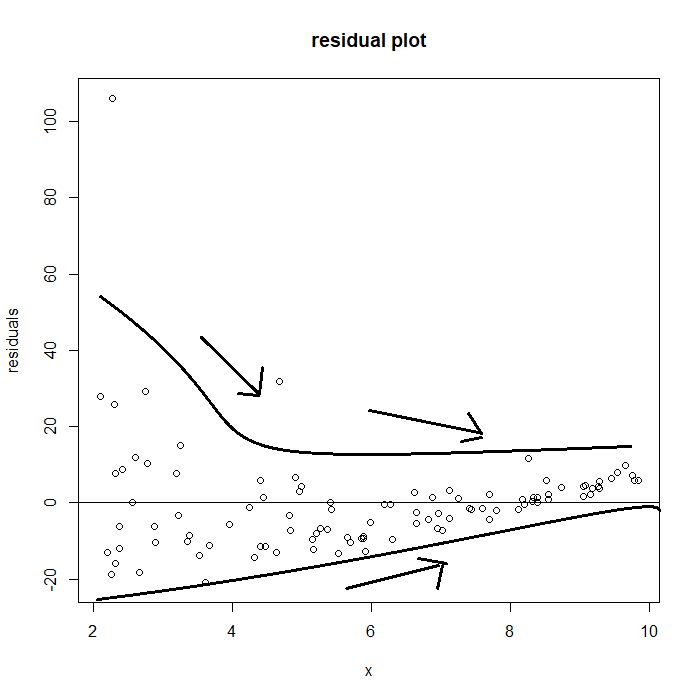
I have created a linear model in R, and then plotted the residuals. If my residual plot looks like this, then which model assumptions are not appropriate?
$\begingroup$
$\endgroup$
1
-
2$\begingroup$ It looks like there is some heteroscedasticity in your residuals, also a linear fit may not be appropriate, since in the middle the residuals are mostly below the line, while at the right end they are almost all above the line. $\endgroup$– user2974951Commented Mar 9, 2020 at 10:36
Add a comment
|
1 Answer
$\begingroup$
$\endgroup$
1
There might be some heteroskedasticity, since for lower x values there is a much larger (vertical) spread in the residuals. Also there is maybe curvature in the plot, for x larger than about 9 all the residuals are positive, while for lower x values (around 4 to 7) most are negative. To get better advice you need to tell us more, what is the context, what is your variables, what is your modeling goal?
-
1$\begingroup$ I will edit my question later. I figured out what I was looking for, and will write what I did in edit $\endgroup$– user255658Commented Mar 9, 2020 at 13:12

