5
$\begingroup$

I have fitted the following linear mixed model based on the results of an economic game:

lmer(TotalScore~perOOgivenP+Game+(1|Subject),REML=T,data=mdl1table)->m1

TotalScore is a integer.
perOOgivenP is a proportion between 0 and 1 (most of which are 0).
Game is numeric and tells us if it is the 1st or 2nd game played by the participant

The QQ plot looks good so I am confident the residuals are normally distributed. The fitted vs. residuals plot does not look so good. To me it looks like the residuals are biased. I am not sure what Is causing this or what to do about it?

Could it be caused by the amount of 0's in perOOgivenP (32/46 data points). perOOgivenP is the proportion of times a particular behaviour was made. Would anyone suggest making this binary as in 0 or 1 (actual value not 0).

perOOgivenP is as follows:

 [1] 0.500000 1.000000 0.333333 0.000000 0.000000 0.000000      NaN 0.166667 0.250000 0.800000
[11] 0.166667 0.000000 0.333333 0.000000 0.000000      NaN      NaN 0.000000 0.000000 0.000000
[21]      NaN 1.000000      NaN 0.000000      NaN 0.000000 0.000000      NaN      NaN      NaN
[31]      NaN 0.000000      NaN 0.000000 0.000000 0.000000      NaN      NaN      NaN 1.000000
[41]      NaN 0.000000 0.411765 0.000000 0.000000      NaN      NaN 0.000000 0.200000 0.000000
[51]      NaN 0.000000 0.333333 0.000000 0.250000      NaN 0.000000      NaN      NaN      NaN
[61] 0.000000      NaN 0.000000 0.000000      NaN 0.000000      NaN      NaN      NaN 0.000000
[71] 0.000000 0.000000 0.000000      NaN      NaN      NaN      NaN      NaN      NaN      NaN
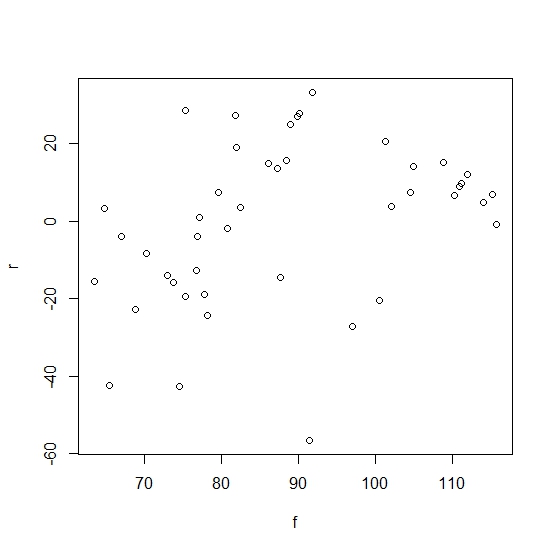
Fitted vs. residuals plot

$\endgroup$
2
  • $\begingroup$ What do you mean by "biased residuals" ? If you compute the average value of the residuals, you find 0. $\endgroup$ Commented Jan 16, 2013 at 18:59
  • $\begingroup$ I'm not so sure I see anything wrong with your fitted values vs. residuals plot -- but to be fair there are too few points for me to simply eye-ball accurately. There is maybe a small curve linear relationship where the residuals tend to skew positive for middle values around 90, but it's tough to say. Have you considered carrying out format tests for constancy of error variance? $\endgroup$ Commented Feb 7, 2019 at 19:41

3 Answers 3

6
$\begingroup$

By "biased" you presumably mean that there is some non-linear structure left in the residuals. It's by no means obvious to me that this is the case here.

Before leaping to any conclusions - and certainly before losing any information by transforming variables into a less-informative state - I would look at more residual plots. An obvious one would be to give a different colour or shape to the residuals where the suspect variable has a value of zero and see how this impacts on the residuals.

$\endgroup$
1
$\begingroup$

If perOOgivenP has too many zeroes, it may cause the coefficients fails to NA. It can be a big problem. Even if you get the fitting values, it may not be accurate. You need to show more information about this variable.

It is hard to say whenther this residual plot is biased or not. One obvious thing you can do is to run lm(residuals~c(1:n)), where n is the length or residuals. The coefficients of the fitting line should be close to 0. Also, I suggest use abline(h=0) for residual plot.

$\endgroup$
1
  • $\begingroup$ Coefficients: (Intercept) c(1:80) 0.044427 -0.001097. I have plotted TotalScore against the residuals and can see that the residuals increase linearly with Total Score, could the cause? if so what would you recommend doing about it? $\endgroup$ Commented Jan 18, 2013 at 14:20
0
$\begingroup$

You could try plotting the standardized residuals and see if very few of them have an absolute value greater than 3.

But the elephant in the room is, if perOOgivenP is a proportion, you need to normalize your data (at which point even more of it will become missing observations). Ideally, you would have a large enough number of trials for each observation that the zeros would be replaced by small real numbers. If that's not practical, perhaps you could try Poisson regression or survival analysis with recurring events (you can use Subject as a clustering or frailty term).

But in any case, the data as shown violate normality assumptions.

$\endgroup$

Your Answer

By clicking “Post Your Answer”, you agree to our terms of service and acknowledge you have read our privacy policy.

Not the answer you're looking for? Browse other questions tagged or ask your own question.