I am modeling body mass (y var) according to indices of dysregulation for different physiologic systems (x vars). I did a likelihood ratio test, which supported using a linear mixed model, with a random effect of individual, over a simple linear model.
library(lme4)
require(RLRsim)
mod1 <- lm(mass_kg_zscore ~ metabolic_index + immune_index + neuro_index, data = pb)
mod2 <- lmer(mass_kg_zscore ~ metabolic_index + immune_index + neuro_index + (1|id), data = pb, REML = FALSE)
exactLRT(mod2,mod1) # individual, null - tests individual
# P =0.0026, so there is support for keeping the RE of individual
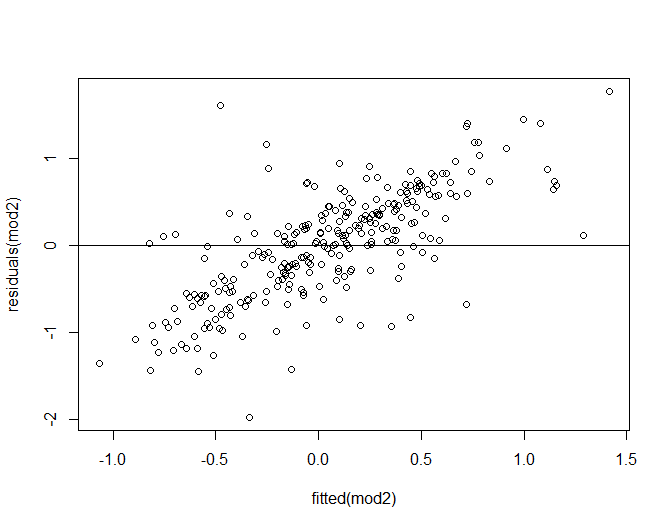
However, the residuals vs. fitted plot for the linear mixed model looks pathologic:
plot(fitted(mod2),residuals(mod2))
abline(h = 0)
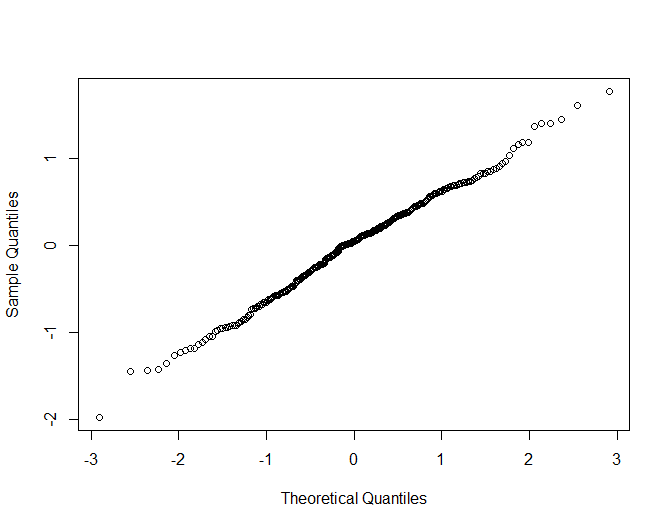
The QQ plot for mod2 looks relatively okay:

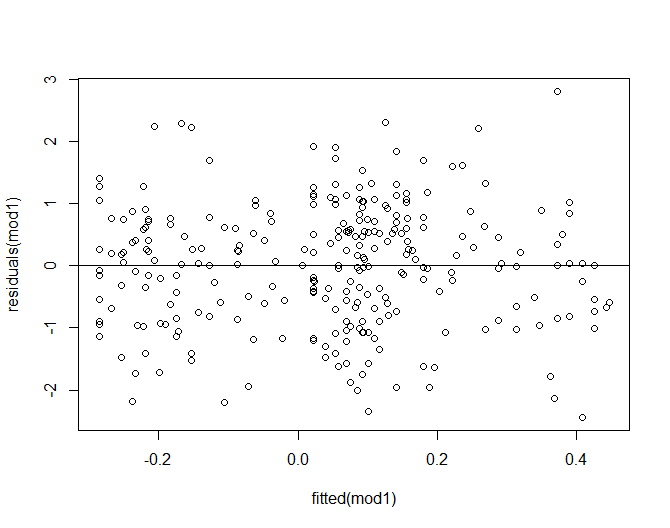
Now, if I remove the random effect of individual, and just do a simple linear model, my residuals vs. fitted plot looks much better:
My question is, why does the inclusion of the random effect cause such a wonky residuals vs. fitted plot? Does this mean I should exclude the RE, even though the likelihood ratio test supported keeping the RE in the model?
Thank you!


