I think you are asking whether a paired t test
is the same thing as a one-sample t test on the
paired differences. If so, the answer is Yes.
Simulated data. I illustrate using fake paired data simulated in R as
follows.
set.seed(519)  # for reproducibility
before = round(rnorm(100, 200, 25))
increase = round(rnorm(100, 6, 6))
after = before + increase
diff = after - before
In the case of actual experimental data, you would see before and after as you look at test scores, and increase
would be available only on upon taking differences. [Please ignore the variable increase used only for simulation; it is the same as diff/]
Datapoints for the first six of 100 simulated
subjects are as follows:
head(cbind(before, after, diff))

      before after diff
[1,]    192   195     3
[2,]    230   236     6
[3,]    202   197    -5
[4,]    153   151    -2
[5,]    239   249    10
[6,]    178   179     1
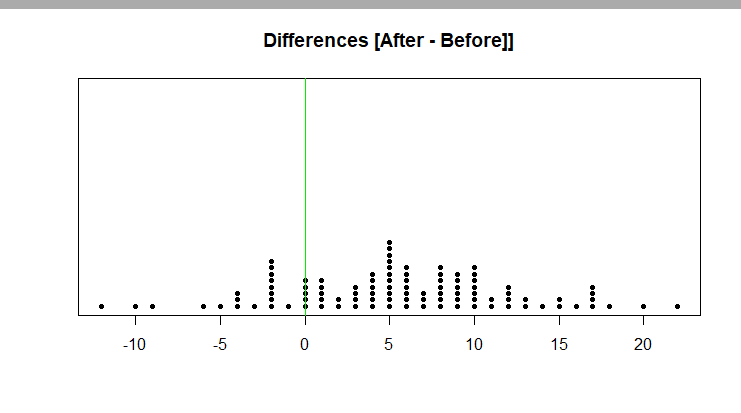
We show a stripchart (dotplot) of diff. Over 3/4, but not all, of the subjects show positive differences.
[For our purposes, individual graphs of before and after are not useful; they would not show pairing and so might be misleading.]
stripchart(diff, meth="stack", pch=20, ylim=c(1,1.1),
           main="Differences [After - Before]]")
abline(v=0, col="green2")
mean(diff > 0)
[1] 0.77

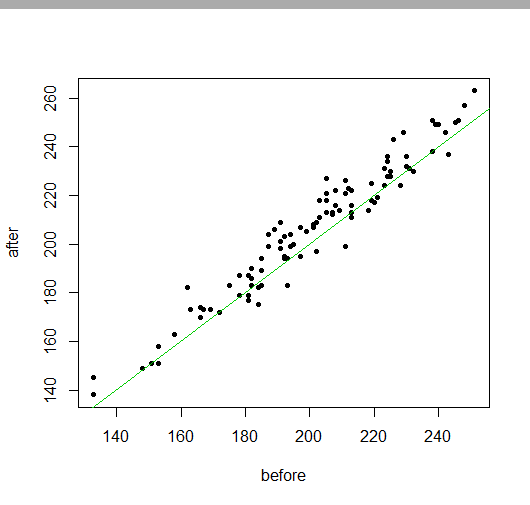
Correlation. On expects before and after scores to be correlated because of the pairing: the first 'before'
score is from the same subject as the first after score. Thus, there will typically be positive association between before and after, even if not typically as strong as in my simulated data.
The correlation $r$ between 'before' and 'after' is
nearly $1$ and a scatterplot shows a nearly linear
pattern for pairs. Points below the 45-degree line correspond to subjects that showed no improvement.
cor(before, after)
[1] 0.9696317

plot(before, after, pch=20)
abline(a=0, b=1, col="green3")

Tests. Now we compare results from two t tests in R:
(a) a paired test for before and after and
(b) a one-sample t test for diff. Notice that
results are the same: the t statistic 8.3978, estimated
improvement 5.53, and (very small) P-value 3.347e-13 are identical between the two tests.
t.test(after, before, pair=T)  # paired test

        Paired t-test

data:  after and before
t = 8.3978, df = 99, p-value = 3.347e-13
alternative hypothesis:
  true difference in means is not equal to 0
95 percent confidence interval:
 4.223386 6.836614
sample estimates:
mean of the differences
                   5.53

t.test(diff)   # one-sample test of 'diff'

        One Sample t-test

data:  diff
t = 8.3978, df = 99, p-value = 3.347e-13
alternative hypothesis:
  true mean is not equal to 0
95 percent confidence interval:
 4.223386 6.836614
sample estimates:
mean of x
     5.53
Incorrect two-sample t tests. However, if you were incorrectly to do a two-sample t test,
then the before and after are treated as two independent samples ('pairing' is ignored), and
results of the test are substantially
different---both numerically and in format.
The 'Welch' t test, which does not assume equal variances, is shown in full; only the P-value of the 'pooled' t test is shown. Neither of these incorrect
tests shows a significant difference between 'before' and 'after'.
t.test(before, after)  # 'before' & 'after'
                       # treated as if independent

        Welch Two Sample t-test

data:  before and after
t = -1.4757, df = 197.79, p-value = 0.1416
alternative hypothesis:
  true difference in means is not equal to 0
95 percent confidence interval:
 -12.919855   1.859855
sample estimates:
mean of x mean of y
   201.31    206.84

t.test(before, after, var.eq=T)$p.val  # pooled
[1] 0.1416086
Note on nonparametric tests: If data are not normal, you may choose
to use a Wicoxon signed-rank test to judge whether differences are mostly positive. Equivalently, you might do a paired test on After and Before.
wilcox.test(diff)

        Wilcoxon signed rank test
        with continuity correction

data:  diff
V = 4069, p-value = 3.052e-11
alternative hypothesis: true location is not equal to 0

wilcox.test(after, before, pair=T)

        Wilcoxon signed rank test
        with continuity correction

data:  after and before
V = 4069, p-value = 3.052e-11
alternative hypothesis:
  true location shift is not equal to 0
However, it would be incorrect to do a two-sample Mann-Whitney-Wilcoxon
rank sum test as if Before and After were two independent samples.
wilcox.test(after, before)

        Wilcoxon rank sum test
        with continuity correction

data:  after and before
W = 5602, p-value = 0.1416
alternative hypothesis:
  true location shift is not equal to 0


