2
$\begingroup$

I ran across two very similar problems but each one's supposed answer is approached very differently.

Problem 1: A large study of serum folate levels in a sample of women age 16-45 reveals that this parameter is normally distributed by a mean of 5.0 ng/mL and a standard deviation of 0.5 ng/mL. According to the study results, 95% of serum folate observations in these patients will lie approximately between which of the following limits?

A. 3.5 and 6.0 ng/mL B. 3.5 and 6.5 ng/mL C. 4.0 and 6.0 ng/mL D. 4.0 and 5.5 ng/mL E. 4.5 and 5.5 ng/mL

The solution for the above problem is obvious (meaning, easy to understand). In a normally distributed data, the range for 95% should be +/- 2 standard deviation value away from the mean, so the answer to the above is 'C'.

Now this is another problem in a similar vein:

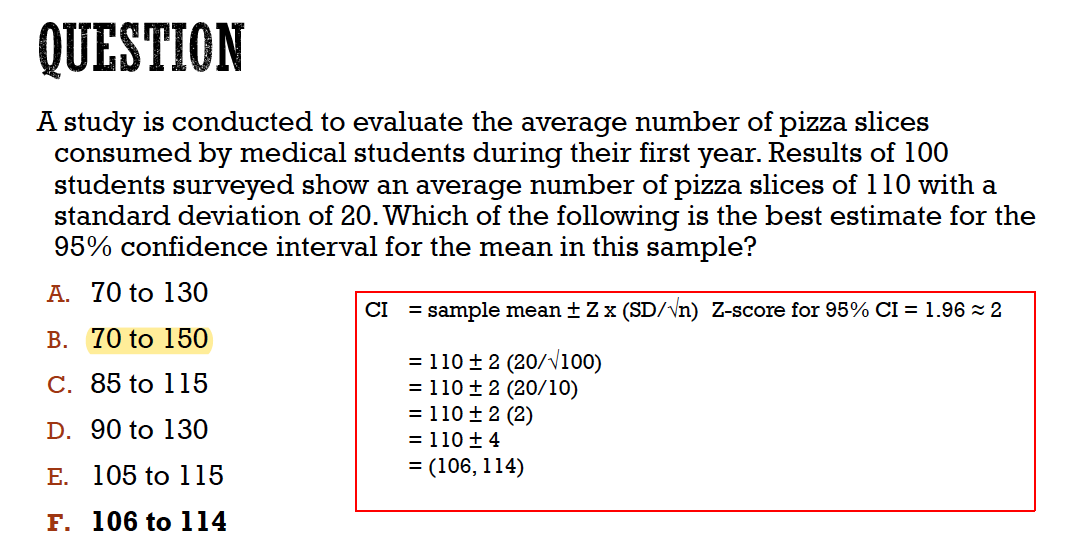
enter image description here

As you can see, the answer (based on the explanation provided along with it) is 'F'. Could someone explain me in a simple way (I'm not very strong on statistics) why I cannot use +/- 2 standard deviation approach in problem 2 above and choose 'B' as the answer? What am I missing?

Thank you in advance for your answers/explanation!

$\endgroup$
4
  • 1
    $\begingroup$ Take a look at our highest-voted posts on confidence intervals. $\endgroup$
    – whuber
    Commented May 19, 2020 at 22:07
  • 3
    $\begingroup$ @user1330974 The second is about sample means of observations, not the observations themselves. This is a critical distinction, since sample means are less variable than the observations they are based on. $\endgroup$
    – Glen_b
    Commented May 20, 2020 at 1:04
  • $\begingroup$ @Glen_b-ReinstateMonica Could you please elaborate a bit more? I tried looking through the link from whuber (comment above yours), but none of the top answers have explanation that I'm looking for. If the second problem is about sample means of observation, then what is the first problem about? From my layman's understanding, the first problem also provides us a mean value of observation (5.0 ng/mL), doesn't it? $\endgroup$ Commented May 20, 2020 at 1:38
  • $\begingroup$ That's the population mean, not the sample mean. The first problem looks at the distribution of individual values, the CI in the second relates to the distribution of sample means. Sample means have smaller variance than individual observations do. This will be discussed at length in your textbook or notes. $\endgroup$
    – Glen_b
    Commented May 20, 2020 at 2:29

1 Answer 1

2
$\begingroup$

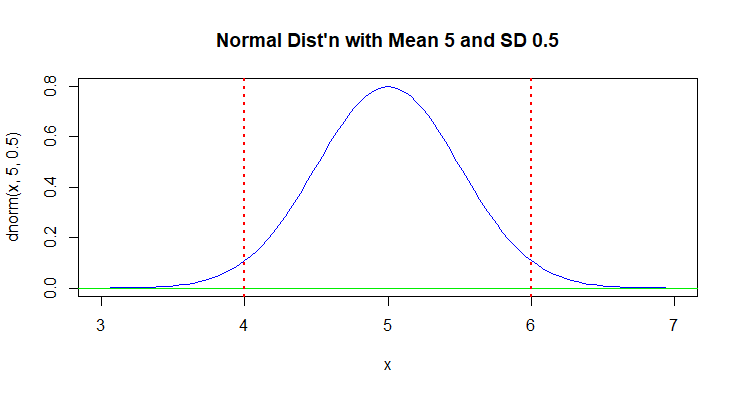
Sampling one individual from a population. In the first situation, The population is distributed normally with mean $\mu = 5$ and standard deviation $\sigma = 0.5.$ Then about 95% of the population lies within the interval $\mu \pm 2\sigma,$ which amounts to the interval $(4, 6).$ Here is a graph of the normal distribution with vertical dotted lines at $4$ and at $6.$ Then 95% of the probability (area) under the curve lies between the dotted lines.
enter image description here

Averaging a large sample from a population. In the second situation, Suppose for the sake of argument that the population has $\mu = 110$ and $\sigma = 20.$ Suppose you take a sample of $n = 100$ people from that distribution and take its sample mean $\bar X.$ Then one can show that $\bar X$ has a normal distribution with mean $\mu_{\bar X} = \mu = 110$ and $\sigma_{\bar X} = \sigma/\sqrt{n} = 20/\sqrt{100} = 20/10 = 2.$

I suppose that sounds very technical. But, intuitively, it makes sense that a sample average must be less variable than the population from which it was drawn. The population has a few people who eat very little pizza and some others who eat pizza moderately and a few who eat massive amounts of pizza. If we sample just one person from the population we could get any of the above types of pizza eaters.

But if we sample a large number of people, we are likely to encounter a broad spectrum of pizza eaters. If we average this diverse sample, we can expect the average to be less variable than the population. This argument doesn't tell you to divide by $\sqrt{n},$ but it does say why the variance of the sample mean is smaller. More on this below.

So $\bar X$ has a 95% chance of being within $2\sigma_{\bar X} = 4$ of $\mu = 110.$ But from data at hand we know $\bar X = 110$ and we're trying to use this sample mean to estimate the unknown population mean. Because be know $\bar X = 110$ and $\mu$ are likely to be 4 units (pizzas) apart, it is reasonable to guess that $\mu$ lies in the interval $\bar X \pm 4.$ We say that a 95% confidence interval for $\mu$ is the interval $110 \pm 4$ or $(106, 114).$

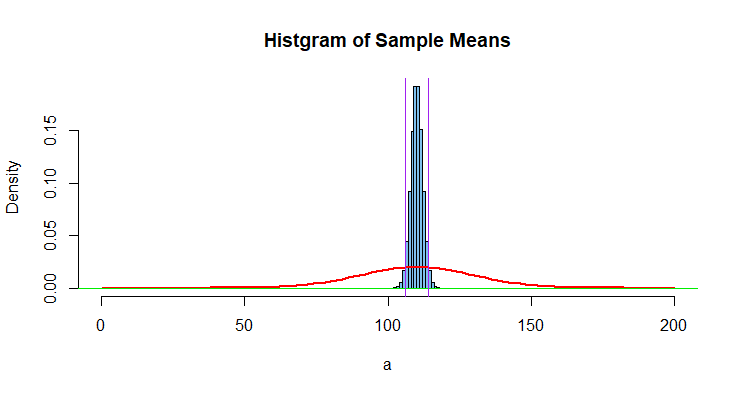
As a simulation experiment, I took many samples of size $n = 100$ from a normal population with mean $\mu = 110$ and standard deviation $\sigma = 20.$ I took the average $A = \bar X$ of each of the many samples. (Because simulation is cheap, I took a million samples of size $n = 100.)$

The histogram of all these $A$'a is shown below along with the (much more spread out) density curve of a normal distribution with mean $\mu$ and standard deviation $\sigma = 10.$ The vertical purple lines are at $106$ and $114.$
enter image description here

Notes: (1) According to the scale used to plot the second figure the total area underneath the red curve is $1.$ Also, the total area within the histogram bars is $1.$ Roughly speaking, the histogram is $1/10$th as 'wide' as the curve, so it needs to be $10$ times as 'tall' in order for both areas to be $1.$

(2) In case it is of interest to anyone, the R code for the simulation and the second figure is given below.

a = replicate(10^6, mean(rnorm(100, 110, 20)))
hist(a, prob=T, col="skyblue2", xlim=c(0,200), 
     main="Histgram of Sample Means")
 curve(dnorm(x,110,20), add=T, lwd=2, col="red")
 abline(h=0, col="green2")
 abline(v=c(106, 114), col="purple")
$\endgroup$
5
  • 1
    $\begingroup$ Thank you VERY MUCH for explaining the difference between population and sample mean and the way to extrapolate population mean's CI from sample mean!. I wish though that the statistical problems and lingo distinguishes sample and population means clearly (because from the statement of Problem 1, I couldn't tell it was giving us population mean because it reads, "A large study of serum folate levels in a sample of women age 16-45 reveals that this parameter is normally distributed." It sounded to me like the mean of 5.0 ng/mL is sample means there as well. $\endgroup$ Commented May 20, 2020 at 21:39
  • 1
    $\begingroup$ :-) I admit that textbook problems aren't always worded as precisely as one would wish. (It sometimes helps to know what has been covered just before the problem appears.) However, if you look carefully at your 1st problem, you'll see no mention of taking a sample and with luck you might read 'these patients' as 'these individual patients' $\endgroup$
    – BruceET
    Commented May 20, 2020 at 23:15
  • $\begingroup$ Thank you for the follow-up and spending time patiently explaining me about this! Sorry that I keep asking you more and more, but your comment above, "", seems to imply that in problem 1, the mean given is of sample mean? If so, shouldn't we be using the same approach as problem 2 to calculate 95% confidence interval? $\endgroup$ Commented May 21, 2020 at 1:18
  • 1
    $\begingroup$ No. Problem 1 mentions a 'large study', no sample size, and no sample mean to be found. (The "sampling" was to pick a large number of women in the desired age range for the large study.) In this problem, we're dealing with one individual subject and trying to decide what boundaries on folate levels will include her folate level with probability 95%. (That's the only reasonable interpretation. I can't help that the problem is badly worded. I've written a couple of texts of my own and I wish I could say there were no badly worded problems anywhere in them.) $\endgroup$
    – BruceET
    Commented May 21, 2020 at 1:44
  • $\begingroup$ Thank you very much for the follow-up answer and patiently helping me understand the nuances of confidence interval calculation! :) $\endgroup$ Commented May 22, 2020 at 14:39

Your Answer

By clicking “Post Your Answer”, you agree to our terms of service and acknowledge you have read our privacy policy.

Not the answer you're looking for? Browse other questions tagged or ask your own question.