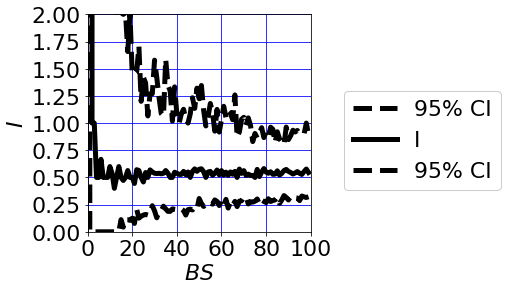
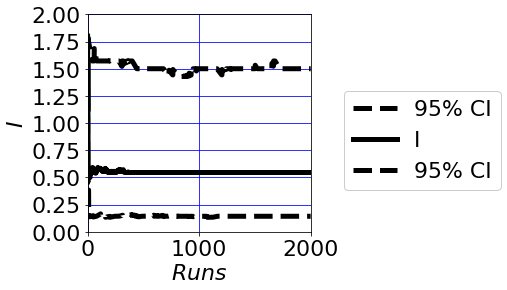
I'm getting
I = 52% [39%, 55%]
when I make the assumption that the sample is just as representative of the population for method A as it is for method B. This is the other extreme from assuming independence.
multinomCI gives the Wilson CI for P11, P10, P01, P00.
I want to get P11, P10, P01, P00 for a given location in probability space (u)
0 < u < 1
I assume that the CI is about symmetric and that therefore:

I varied the step size (S) for how many equally distributed samples I took from u
u = [S to 1-S, step S]
This gave:
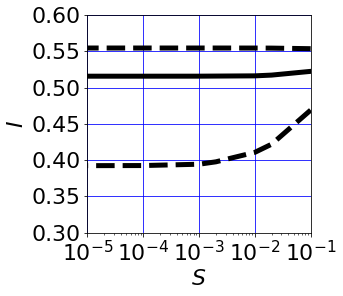
Figure 1, Improvement (I) against step size (S)
In python:
import numpy as np
import rpy2.robjects as ro
from rpy2.robjects.packages import importr
import matplotlib.pyplot as plt

package_name = "DescTools"

try:
    pkg = importr(package_name)
except:
    ro.r(f'install.packages("{package_name}")')
    pkg = importr(package_name)
pkg

print('Confidence Level (CL) = fun(u), assuming symmetry')
def C_L(u):
    if u >= 0.5:
        return 2*(u-0.5)
    else:
        return -2*(u-0.5)

print('Vary u')
steps = [1e-1,2e-2,1e-2,2e-3,1e-3,1e-4,1e-5]

# CI(I) for various steps
CI_I = {}

for step in steps:
    Ues = np.linspace(step,1-step,int(1/step))

    # Vary the CL
    CLs = [C_L(element) for element in Ues]

    CIes = {}
    P11s = {}
    P10s = {}
    P01s = {}
    P00s = {}
    pA_s = {}
    pB_s = {}
    I_es = {}

    for u in Ues:

        # CL
        CL = C_L(u)

        # CI (P11, P10, P01, P00)
        r_string = """CI = MultinomCI(c(11,0,6,11), conf.level=CL, method="wilson")
        """.replace('CL',str(CL))
        ro.r(r_string)
        CIes[CL] = np.array(ro.r['CI'])

        # P11
        if u >= 0.5:
            P11s[u] = (CIes[CL][:,2][0])
        else:
            P11s[u] = (CIes[CL][:,1][0])

        # P10
        if u >= 0.5:
            P10s[u] = (CIes[CL][:,2][1])
        else:
            P10s[u] = (CIes[CL][:,1][1])

        # P01
        if u >= 0.5:
            P01s[u] = (CIes[CL][:,2][2])
        else:
            P01s[u] = (CIes[CL][:,1][2])

        # P00
        if u >= 0.5:
            P00s[u] = (CIes[CL][:,2][3])
        else:
            P00s[u] = (CIes[CL][:,1][3])

        # pA = P_11 + P_10
        pA_s[u] = P11s[u] + P10s[u]

        # pB = P_11 + P_01
        pB_s[u] = P11s[u] + P01s[u]

        # Improvement (I) = pB/pA-1
        I_es[u] = pB_s[u]/pA_s[u]-1

    # CI(I)
    CI_I[step] = [np.percentile(list(I_es.values()),  2.5),
                  np.percentile(list(I_es.values()), 50),
                  np.percentile(list(I_es.values()), 97.5)]

print('CI_I = ',CI_I)

# Dict to Lists
labels, CI_data = [*zip(*CI_I.items())]

Low = [item[0] for item in CI_data]
Med = [item[1] for item in CI_data]
H_i = [item[2] for item in CI_data]

# Plot
fig, ax = plt.subplots(1, 1)
ax.plot(steps, Low, linewidth=5, color='k', linestyle='--')
ax.plot(steps, Med, linewidth=5, color='k', linestyle='-')
ax.plot(steps, H_i, linewidth=5, color='k', linestyle='--')

for item in ([ax.title, ax.xaxis.label, ax.yaxis.label] +
             ax.get_xticklabels() + ax.get_yticklabels()):
    item.set_fontsize(22)

plt.xlabel('$S$')
plt.ylabel('$I$')
plt.grid(b=True, which='major', color='b')
ax.set_xscale('log')
plt.xlim([min(steps),max(steps)])
plt.ylim([0.3,0.6])

fig = plt.gcf()
fig.set_size_inches(4,4)
plt.show()
plt.clf()
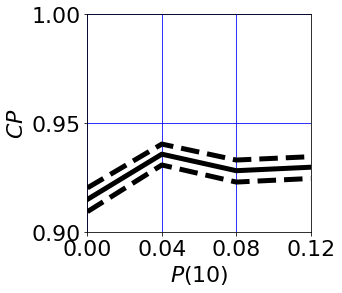
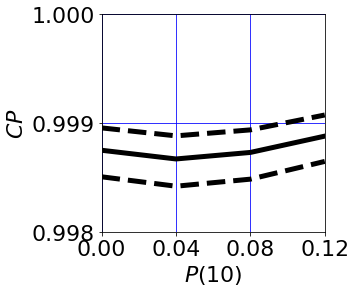
Coverage
I think the coverage is around 32%, vastly under the target 95%.

Figure 2, Coverage Probability (CP) against P(10)
I assessed it with a simulation, using the same approach as for the Bootstrap answer. With 10,000 samples for each of the same 4 P(10) values that I used to asses the bootstrap technique it took 32 hours to run.
In python:
import numpy as np
import pandas as pd
import time
import pickle
import statsmodels.api
import rpy2.robjects as ro
from rpy2.robjects.packages import importr
import matplotlib.pyplot as plt

package_name = "DescTools"

try:
    pkg = importr(package_name)
except:
    ro.r(f'install.packages("{package_name}")')
    pkg = importr(package_name)
pkg

start = time.time()

print('Control Parameters')
n = 28
print('sample size (n) = ',n)

nrep = 10000
print('coverage sample size = ',nrep)

step = 1e-4
print('Probability space step size = ',step)

print('Equal points in probability space: 0 < u < 1')
Ues = np.linspace(step,1-step,int(1/step))

print('Confidence Level (CL) = fun(u), assuming symmetry')
def C_L(u):
    if u >= 0.5:
        return  2*(u-0.5)
    else:
        return -2*(u-0.5)

d_CP = {}
d_Re = {}
CI_I = {}

P_10s = [0.00, 0.04, 0.08, 0.12]

for P_10 in P_10s:
    pvals = [.3, P_10, (.3-P_10), .4]
    print('Prob ',pvals)
    print('total P = ',sum(pvals))

    P11 = pvals[0]
    P10 = pvals[1]
    P01 = pvals[2]
    P00 = pvals[3]

    I_T = (P11+P01)/(P11+P10)-1
    print('True I  = ',I_T)

    print('Estimate the Coverage Probability using simulation')
    CP = []

    for it in range(nrep):

        # Generate sample data
        ExeS = np.random.multinomial(n, pvals)

        CIes = {}
        P11s = {}
        P10s = {}
        P01s = {}
        P00s = {}
        pA_s = {}
        pB_s = {}
        I_es = {}

        for u in Ues:

                # CL
                CL = C_L(u)

                # CI (P11, P10, P01, P00)
                r_string = """CI = MultinomCI(c(P1,P2,P3,P4), conf.level=CL, method="wilson")
                """.replace('CL',str(CL)).replace('P1',str(ExeS[0])).replace('P2',str(ExeS[1])).replace('P3',str(ExeS[2])).replace('P4',str(ExeS[3]))
                ro.r(r_string)

                CIes[CL] = np.array(ro.r['CI'])

                # P11
                if u >= 0.5:
                    P11s[u] = (CIes[CL][:,2][0])
                else:
                    P11s[u] = (CIes[CL][:,1][0])

                # P10
                if u >= 0.5:
                    P10s[u] = (CIes[CL][:,2][1])
                else:
                    P10s[u] = (CIes[CL][:,1][1])

                # P01
                if u >= 0.5:
                    P01s[u] = (CIes[CL][:,2][2])
                else:
                    P01s[u] = (CIes[CL][:,1][2])

                # P00
                if u >= 0.5:
                    P00s[u] = (CIes[CL][:,2][3])
                else:
                    P00s[u] = (CIes[CL][:,1][3])

                # pA = P_11 + P_10
                pA_s[u] = P11s[u] + P10s[u]

                # pB = P_11 + P_01
                pB_s[u] = P11s[u] + P01s[u]

                # Improvement (I) = pB/pA-1
                I_es[u] = pB_s[u]/pA_s[u]-1

        # CI(I)
        CI_I[it] = [np.percentile(list(I_es.values()),  2.5),
                    np.percentile(list(I_es.values()), 50),
                    np.percentile(list(I_es.values()), 97.5)]


        Low = CI_I[it][0]
        Med = CI_I[it][1]
        Hig = CI_I[it][2]

        # Check whether the interval contains the true value
        if (I_T < Hig) and (I_T > Low):
            CP.append(1)
        else:
            CP.append(0)

    # results
    d_Re[P_10] = CP
    d_CP[P_10] = sum(CP)/len(CP)

    end = time.time()
    print('time    = ',end - start)

# CI
CI_Low  = []
CI_High = []
for P_10 in d_CP.keys():
    low, high = statsmodels.stats.proportion.proportion_confint(d_CP[float(P_10)]*nrep,
                                                                nrep,
                                                                alpha=1-0.95,
                                                                method='wilson')
    CI_Low.append(low)
    CI_High.append(high)


print('Plot')
df_G1 = pd.DataFrame({'P_10' : list(d_CP.keys()),
                      'CP'   : list(d_CP.values()),
                      'Lo'   : CI_Low,
                      'Hi'   : CI_High})

fig, ax1 = plt.subplots(1,1)

df_G1.plot(x='P_10', y='Hi', legend=False, ax=ax1, label='95% CI',  linewidth=5, color='k', linestyle='--')
df_G1.plot(x='P_10', y='CP', legend=False, ax=ax1, label='CP',      linewidth=5, color='k', linestyle='-')
df_G1.plot(x='P_10', y='Lo', legend=False, ax=ax1, label='95% CI',  linewidth=5, color='k', linestyle='--')

for item in ([ax1.title, ax1.xaxis.label, ax1.yaxis.label] +
             ax1.get_xticklabels() + ax1.get_yticklabels()):
    item.set_fontsize(22)

plt.xlabel('$P(10)$')
plt.ylabel('$CP$')

plt.xlim([0,0.12])
plt.ylim([0,1])
plt.xticks([0.00, 0.04, 0.08, 0.12])

plt.grid(which='both', color='b')

fig = plt.gcf()
fig.set_size_inches(4,4)
plt.show()
plt.clf()


