1
$\begingroup$

When sampling K numbers out of 1,...,N with replacement, and calculating the histogram of the sampled set - what's the distribution? Or if that's to hard, whats the expectation of each bin in the histogram?

Ex: Sampling K=5 out of N=3, we could get the set 2,2,2,3,3 in which case the histogram would be 0,3,2. The histogram has N elements, and I'm asking how each of them distributes.

$\endgroup$
4
  • 1
    $\begingroup$ I think it depends with what probabilities you sample from the numbers $1,2,...,N$ and also you might need a much larger $K$ in order to understand how these numbers are distributed. $\endgroup$
    – Fiodor1234
    Commented Apr 13, 2021 at 19:59
  • $\begingroup$ I assume a uniform sampling distribution. K and N are parameters of the histogram's distribution. $\endgroup$ Commented Apr 13, 2021 at 23:16
  • $\begingroup$ I think the answer is a Bernoulli distribution with probability 1/N and K repetitions. $\endgroup$ Commented Apr 14, 2021 at 13:33
  • $\begingroup$ But Bernoulli produces outcomes $0$ or $1$, I think what BruceET displays as the answer is really what you need. $\endgroup$
    – Fiodor1234
    Commented Apr 14, 2021 at 13:38

1 Answer 1

2
$\begingroup$

Let $N = 5.$ Then you are simulating the discrete uniform distribution on the integers 1 through $5,$ each with probability $1/5.$

With $K = 1000$ values sampled from among $1$ through $5,$ you ought to get an idea that the simulation process produces values that match this discrete uniform distribution. [I'm using R, following @Fiodor1234's Comment to use a larger $K.]$

set.seed(413)                # for reproducibility of results
x = sample(1:5, 1000, rep=T) # sampling 1000 values at random
summary(x);  length(x);  sd(x)
   Min. 1st Qu.  Median    Mean 3rd Qu.    Max. 
  1.000   2.000   3.000   3.017   4.000   5.000 
[1] 1000     # sample size
[1] 1.3837   $ sample standard deviation (aprx 1.414).

table(x)
x
  1   2   3   4   5 
180 219 194 218 189 

Distribution:

j = 1:5; pdf = rep(1/5, 5)  $ PDF of discrete unif dist'n

$$P(X=1) = P(X=2) = P(X=3) = P(X=4) = P(X=5) = 1/5.$$ Thus $$E(X) = \frac{1}{5}\cdot 1 = \frac{1}{5}\cdot 2 + \cdots + \frac{1}{5}\cdot 5 = \frac{15}{5} = 3,$$ $$Var(X) = E[(X-3)^2] = \frac{1}{5}\left[(-2)^2 + (-1)^2 = 0^2 + 1^2 + 2^2\right] = \frac{10}{5} = 2,$$ and $SD(X) =\sqrt{2} = 1.414.$

sum((1/5)*j)
[1] 3                    # E(X)
sum((1/5)*(j-3)^2)
[1] 2                    # Var(X)

Make a histogram of this sample of 1000 values of $X$ and overlay red dots to show the exact distribution of $X.$

cutp = 0:5 + .5              # boundaries of histogram bins
hist(x, prob=T, br=cutp. col="skyblue2")
 points(j, pdf, pch=19, col="red")
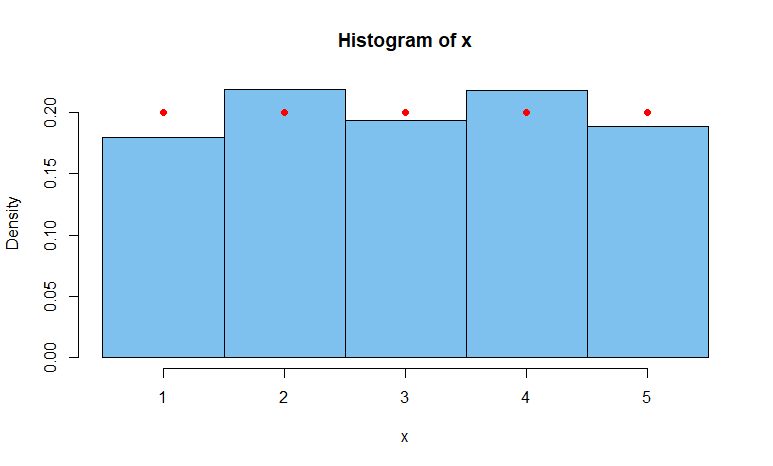
enter image description here

$\endgroup$

Your Answer

By clicking “Post Your Answer”, you agree to our terms of service and acknowledge you have read our privacy policy.

Not the answer you're looking for? Browse other questions tagged or ask your own question.