Let $N = 5.$ Then you are simulating the discrete uniform distribution on the integers 1 through $5,$
each with probability $1/5.$
With $K = 1000$ values sampled from among $1$ through $5,$ you ought to get an idea
that the simulation process produces values that match this discrete uniform
distribution. [I'm using R, following @Fiodor1234's Comment to use a larger $K.]$
set.seed(413)                # for reproducibility of results
x = sample(1:5, 1000, rep=T) # sampling 1000 values at random
summary(x);  length(x);  sd(x)
   Min. 1st Qu.  Median    Mean 3rd Qu.    Max.
  1.000   2.000   3.000   3.017   4.000   5.000
[1] 1000     # sample size
[1] 1.3837   $ sample standard deviation (aprx 1.414).

table(x)
x
  1   2   3   4   5
180 219 194 218 189
Distribution:
j = 1:5; pdf = rep(1/5, 5) $ PDF of discrete unif dist'n
$$P(X=1) = P(X=2) = P(X=3) = P(X=4) = P(X=5) = 1/5.$$
Thus
$$E(X) = \frac{1}{5}\cdot 1 = \frac{1}{5}\cdot 2 + \cdots + \frac{1}{5}\cdot 5 = \frac{15}{5} = 3,$$
$$Var(X) = E[(X-3)^2] = \frac{1}{5}\left[(-2)^2 + (-1)^2 = 0^2 + 1^2 + 2^2\right] = \frac{10}{5} = 2,$$
and $SD(X) =\sqrt{2} = 1.414.$
sum((1/5)*j)
[1] 3                    # E(X)
sum((1/5)*(j-3)^2)
[1] 2                    # Var(X)
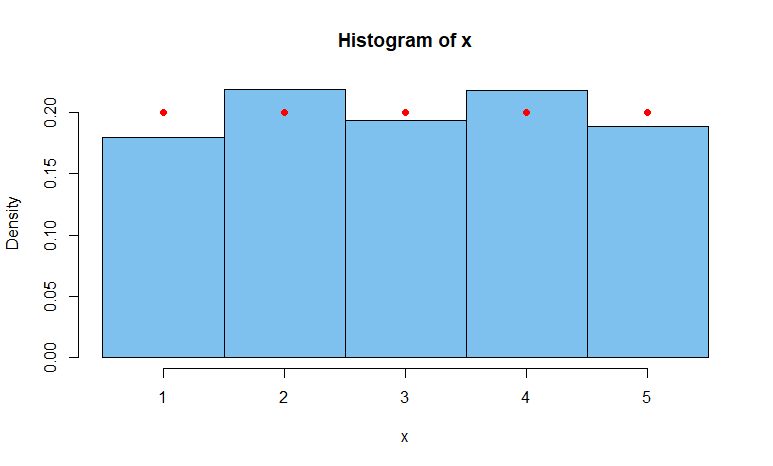
Make a histogram of this sample of 1000 values of $X$ and overlay red dots to show the exact distribution of $X.$
cutp = 0:5 + .5              # boundaries of histogram bins
hist(x, prob=T, br=cutp. col="skyblue2")
 points(j, pdf, pch=19, col="red")


