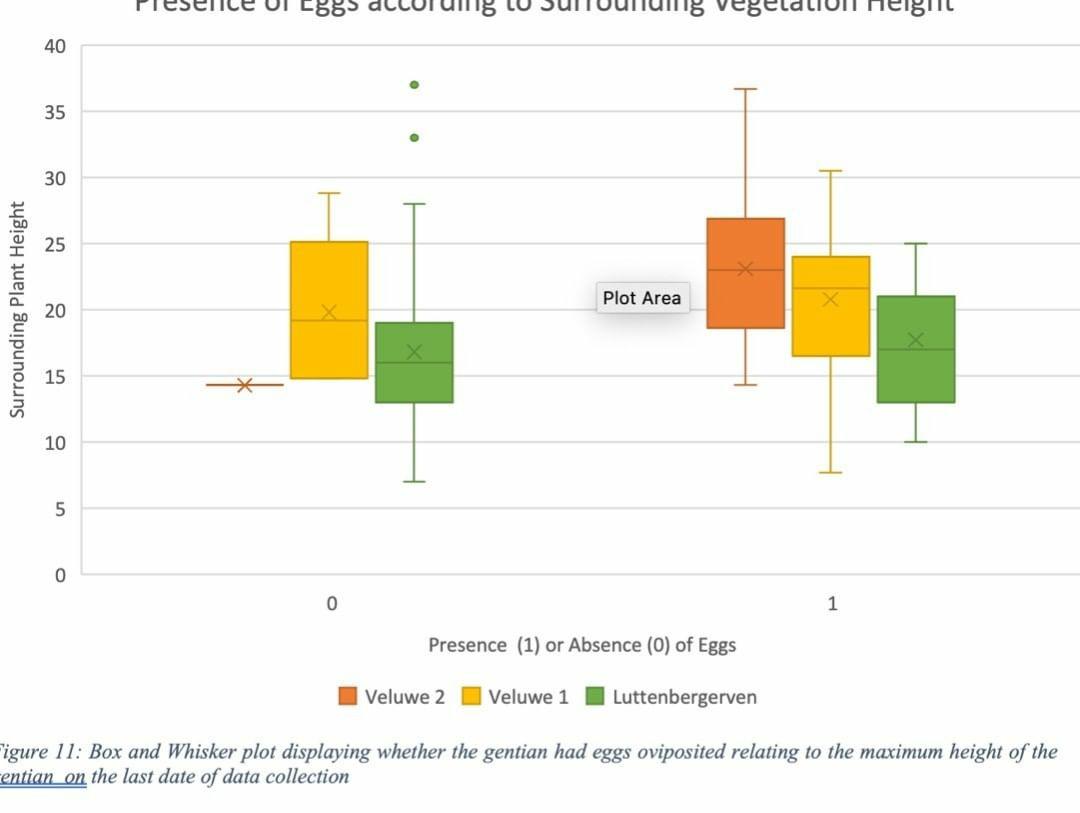
I'm relatively new to statistics and am working on my first independent research. I produced this box plot to display whether plant height had an effect on egg oviposition. I'm having a little trouble interpreting this and presenting the result.
1 Answer
It is possible to manipulate this plot and change what the characteristics represent. Everything I'm going to write represents the standard depiction of this type of plot
Box plot basics
This plot tells you about the distribution, variance, and allows you to compare groups in terms of distribution and variance.
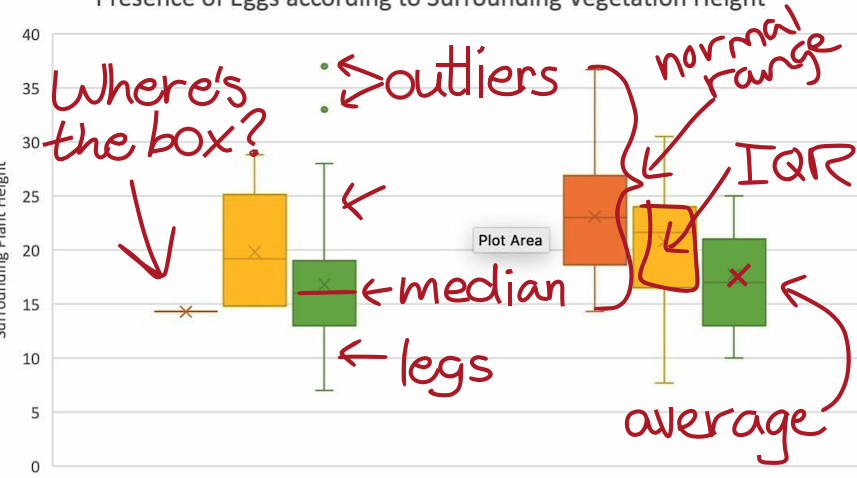
For a box plot, the horizontal line within each box is the median of the group.
It is a safe bet that the X in each box represents the average value of the group. The box size represents the range of values in the interquartile range.
If you put the values in the group in order by value, and split the group evenly four ways, you would create quantiles. The middle two quantiles are the interquartile range. The quartile is the single value at the threshold between quantiles.
The legs or the lines that extend through the center of each box, with perpendicular end caps, represent the normally distributed range of the group. When you see values or asterisks above or below these lines, these are considered outliers.
The method used to determine the outlying values below the line is to take the lowest value in the 'box' (the value that represents the first quartile) and subtract the 1.5 * IQR. At the top end, you add 1.5 * IQR to the largest value in the 'box', the value that represents the 3rd quartile.
Your Box Plot
Where's the Box?
Looking at the visual you provided, the first group, Absence/Veluwe 2 - doesn't have a box. It is probably due to very few values in the group or very little or no difference between the values in the group (relative to the other groups).
If the values in this group were 14.11104, 14.156493680, and 14.3496 there would be no difference reflected here because the other groups have much larger differences in their values (relatively speaking).
Box Size and Variance: Part 1
Do you see how the boxes vary in size? This may indicate that the variance is heterogeneous with enough significance that it could cause a problem in analysis methods that rely on least-squares methods. The outliers would cause issues as well.
Distribution
When you see the mean and median are approximately equal then your data is leaning towards a normal distribution. Combine that with arms that are approximately the same length and the mean and median centered in the box and normal distribution is extremely likely.
Again - relative to the data you're working with - if all the numbers are in the trillions, differences of 100 aren't a big deal - but a 100 here - whew!-
The legs of Presence-Luttenbergerven are pretty approximately equal in length. The median is approximately centered, the average looks pretty close - it's a pretty safe bet that the data in this group is normally distributed.
Box Size and Variance: Part 2
When you look at Presence-Veluwe 2 The legs are a little uneven, but it is a pretty safe bet that this group is normally distributed, as well.
When you look at all three groups that represent Presence, the ranges are about 20, 20, and 15 - it's a pretty safe bet that there is homogeneity - or equal variance between the groups.
The box in this plot represents the center values, so if the range is fairly even, but the boxes are not centered about the arms, the median and mean are uncentered, or vary quite a bit this could be due to variance, distribution, or both.
Please note, I'm not an artist!
-
$\begingroup$ "The legs or the lines that extend through the center of each box [...] represent the normally distributed range of the group" Can you explain what do you mean by the normally distributed range of the group? $\endgroup$ Commented Mar 1, 2023 at 22:13


