0
$\begingroup$

To assess if age is related to my continuous_outcome in my repeated measurements data, I've specified a linear mixed model with a random intercept and slope and a continuous first-order autoregressive variance-covariance structure for the residuals. Because my continuous_outcome was véry skewed, I've transformed this variable (natural log transformation, continuous_outcome_log) and ran the model using this variable.

The data looks as follows:

library(nlme)
library(magrittr)
library(tidyverse)

mydata <- structure(list(pat_id = c(61, 8, 179, 13, 153, 80, 273, 142, 
                                    202, 2, 61, 127, 135, 49, 20, 25, 315, 48, 157, 171, 29, 271, 
                                    105, 14, 14, 84, 180, 125, 255, 135, 39, 49, 320, 160, 197, 189, 
                                    154, 77, 30, 75, 50, 103, 115, 80, 88, 34, 310, 81, 75, 82), 
                         age = c(57.1, 61.4, 60.9, 58.7, 65.4, 44.8, 59, 47.5, 63.4, 
                                 59.8, 55, 66.1, 50.8, 62.8, 71.1, 48.9, 58.1, 49.8, 71.1, 
                                 56.6, 50.1, 40.4, 62.3, 53.3, 53.8, 70.4, 67.2, 68.5, 57.9, 
                                 54.3, 60.9, 61, 54.1, 70.1, 52.4, 70.4, 55.7, 60.7, 56.1, 
                                 60.9, 60, 52.1, 48.8, 40.7, 58.4, 65.3, 62.7, 64.8, 61.2, 
                                 70.7), continuous_outcome = c(2605.440900389, 2063.9, 1929.46472167969, 
                                                               5341.496223986, 1119.6044921885, 566.255950927734, 1880.5290222168, 
                                                               3215.77453613281, 603.7692803513, 7594.527875667, 1775.66680908203, 
                                                               2260.04156843471, 4565.098635412, 6948.76321012, 35685.6, 
                                                               1170.96138000488, 3152.85720825195, 765.9703779527, 4638.270794249, 
                                                               7962.890625, 45.4402923583984, 76.2939453125, 1466.9, 4207.615392583, 
                                                               3410.15625, 11076.9451141357, 20190.12993463, 822.127334531, 
                                                               7512.78955078125, 4146.38368225098, 4292.35992431641, 6393.09959411621, 
                                                               465.39306640625, 8409, 737.1825748757, 3898.624597663, 8238.67454528809, 
                                                               3054.98580932617, 526.4287617193, 7612.90808598633, 2247.54676818848, 
                                                               9231.37016296387, 1067.416015625, 775.980377197266, 10118.2, 
                                                               6744.3, 7616.49208068848, 356.531524658203, 8069.160616877, 
                                                               25596.8906372702), continuous_outcome_log = c(7.86574093001633, 
                                                                                                             7.63283707807243, 7.56551604134912, 8.58344828040522, 7.0216235438582, 
                                                                                                             6.34081061444271, 7.53984003495667, 8.07613443965171, 6.40484703050537, 
                                                                                                             8.93531491566494, 7.48249430865052, 7.72358085708673, 8.42641442900534, 
                                                                                                             8.84646286749209, 10.4825305471662, 7.06643401737976, 8.05638149327426, 
                                                                                                             6.64244817996005, 8.44231247645808, 8.98267293141324, 3.83816745221036, 
                                                                                                             4.34761562539111, 7.29158808696319, 8.34488898720956, 8.13480658905054, 
                                                                                                             9.31271148408861, 9.9129986748043, 6.71311090867393, 8.92449521812674, 
                                                                                                             8.33023297640332, 8.36482490452301, 8.76313090568181, 6.14502876872992, 
                                                                                                             9.03717675296699, 6.60419118543475, 8.26863557047525, 9.01671612519243, 
                                                                                                             8.02485750673053, 6.26801380735694, 8.93773186515778, 7.71803940572248, 
                                                                                                             9.13047108358574, 6.97393247141267, 6.65541509547637, 9.22218988833333, 
                                                                                                             8.81660124504343, 8.93820247123851, 5.87922353910847, 8.99592866402467, 
                                                                                                             10.1502652300912), fu_time = c(2.19, 4.005, 0, 0.857, 0.745, 
                                                                                                                                            4.153, 1.522, 0, 0.12, 3.184, 0, 0.802, 0.517, 1.859, 0.268, 
                                                                                                                                            0, 0, 0.799, 0.446, 0.78, 0, 0, 2.185, 0.953, 1.457, 3.888, 
                                                                                                                                            0.268, 1.295, 0, 3.967, 4.375, 0, 0, 0.479, 0.159, 1.29, 
                                                                                                                                            0, 0, 0.734, 0, 0, 0, 3.584, 0, 0.997, 1.106, 1.506, 0, 0.307, 
                                                                                                                                            0)), row.names = c(NA, -50L), class = c("tbl_df", "tbl", 
                                                                                                                                                                                    "data.frame"))

The regression is specified as follows:

regression <- 
  lme(fixed=continuous_outcome_log ~ 1 + fu_time + age*fu_time,
      random=~1|pat_id, 
      data=mydata, 
      correlation=corCAR1(form=~1 + fu_time|pat_id),
      na.action="na.omit",
      method="REML", 
      control=lmeControl(opt="optim"))

I've subsequently plotted the predicted values of the model as follows:

# Make a prediction dataframe
pframe <- 
  expand.grid(
    fu_time=mean(mydata$fu_time),
age=seq(min(mydata$age), max(mydata$age), length.out=75))

# Add predictions to this dataframe
pframe$predicted_continuous_outcome <- 
  predict(regression, newdata=pframe, level=0)

# Transform (exponentiate) predictions back from the log scale.
pframe$predicted_continuous_outcome <- 
  exp(pframe$predicted_continuous_outcome)

# Make a plot.
predict_plot <- 
  mydata %>% 
  ggplot(
    data=., 
    aes(x=age, y=continuous_outcome)) + 
  geom_point() +
  geom_line(
    data=pframe, 
    aes(x=age, y=predicted_continuous_outcome))
predict_plot

enter image description here

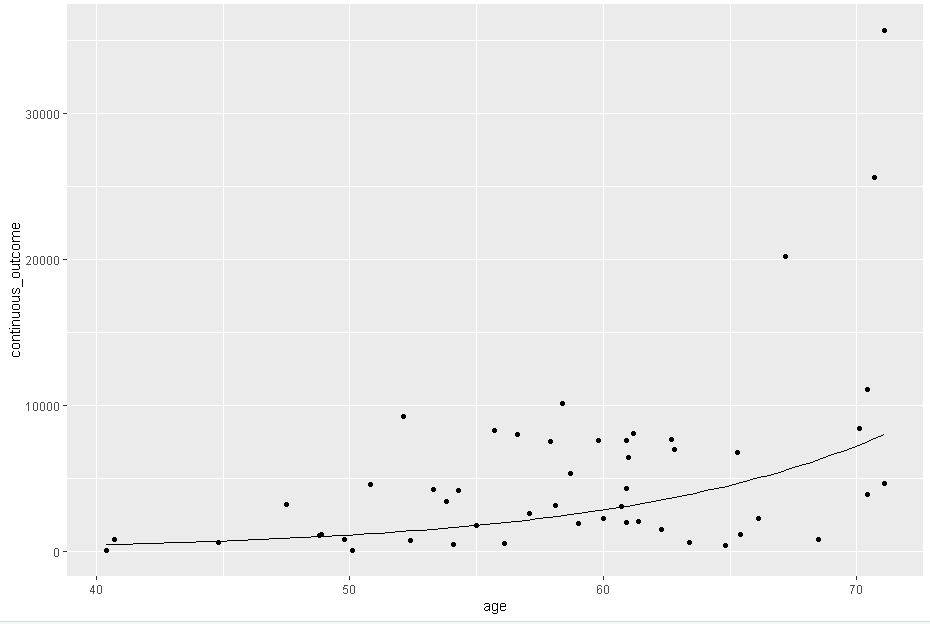
My question is: why is the line of predicted values not a straight line? I have not specified any higher order terms in the model, so shouldn't predictions therefore be on a straight line?

$\endgroup$
2
  • $\begingroup$ You didn't show us your regression model. $\endgroup$ Commented Dec 9, 2021 at 8:34
  • $\begingroup$ I did! But Ill edit the question so its more visible. $\endgroup$
    – tcvdb1992
    Commented Dec 9, 2021 at 9:08

1 Answer 1

1
$\begingroup$

You exponentiated your predictions,

pframe$predicted_continuous_outcome <- 
  exp(pframe$predicted_continuous_outcome)

Thus, they will show exponential growth.

Incidentally, note that your backtransformation will yield conditional medians, not a prediction of the conditional expectation as you might expect. Take a look here - although this is written in the context of time series forecasting, the bias adjustments will also work in other contexts.

$\endgroup$
4
  • $\begingroup$ Hi @Stephan Kolassa, thanks for your answer. Would you know if there is a way to 'get back' to the original scale of my predictions (i.e. backtransforming from e-log scale), without inducing exponential growth in the predictions? Also, after reading the page you referenced and the fable vignette, it's not quite clear to me how to perform the bias adjustment. Do I add the overall variance as a constant to the predictions? $\endgroup$
    – tcvdb1992
    Commented Dec 9, 2021 at 9:25
  • $\begingroup$ (1) The exponential growth is a direct consequence of the log transformation, and there is no way to back-transform without automatically inducing the exponential pattern. If you do not think this makes sense, then don't log transform. (Log transformations make sense if you suspect an underlying multiplicative relationship. A skew in the outcome, by itself, is not a strong reason to log transform.) $\endgroup$ Commented Dec 9, 2021 at 9:28
  • $\begingroup$ (2) The bias-adjusted backtransformation for a prediction $\hat{y}_i$ would be $\exp(\hat{y}_i)(1+\frac{\hat{\sigma}_i^2}{2})$ with the predicted variance $\hat{\sigma}_i^2$ for that instance. The most common way to estimate this is to assume (a) homoskedasticity, so $\hat{\sigma}^2=\hat{\sigma}_i^2$ does not depend on $i$, and (b) estimating $\hat{\sigma}^2$ by the in-sample residual variance, so overall $\exp(\hat{y}_i)(1+\frac{\sigma^2}{2})$. $\endgroup$ Commented Dec 9, 2021 at 9:33
  • $\begingroup$ Thats a pity. I transformed my outcome because the original model I specified,using the untransformed outcome violated the assumption (very much) of normally distributed residuals. Log transforming my outcome resulted in more normally distributed residuals, which is why I did that. $\endgroup$
    – tcvdb1992
    Commented Dec 9, 2021 at 9:36

Your Answer

By clicking “Post Your Answer”, you agree to our terms of service and acknowledge you have read our privacy policy.

Not the answer you're looking for? Browse other questions tagged or ask your own question.