Let's say we measure binary classifier performance by ROC graph, and we have two separate models with distinct AUC (The Area Under the Curve) values. Is the model with the higher AUC value always better?
-
4$\begingroup$ Not necessarily. If sensitivity is more important than specificity for your problem, a model with lower AUC can still be better. $\endgroup$– FirebugCommented Sep 7, 2022 at 13:41
-
3$\begingroup$ If calibration is important to you, then AUC will not help find a well-calibrated model. $\endgroup$– Sycorax ♦Commented Sep 7, 2022 at 13:45
-
4$\begingroup$ define "better" $\endgroup$– Dikran MarsupialCommented Sep 7, 2022 at 14:47
-
1$\begingroup$ Somewhat related: "Are non-crossing ROC curves sufficient to rank classifiers by expected loss?", "Is a pair of threshold-specific points on two ROC curves sufficient to rank classifiers by expected loss?". $\endgroup$– Richard HardyCommented Sep 8, 2022 at 9:14
-
1$\begingroup$ Check out: Hand, David J. "Measuring classifier performance: a coherent alternative to the area under the ROC curve." Machine learning 77.1 (2009): 103-123. $\endgroup$– krkeaneCommented Sep 8, 2022 at 17:49
2 Answers
AUC is a simplified performance measure
AUC collapses the ROC curve into a single number. Because of that a comparison of two ROC curves based on AUC might miss out on particular details that are left out in the transformation of the ROC curve into the single number.
So a higher AUC does not mean a uniform better performance.
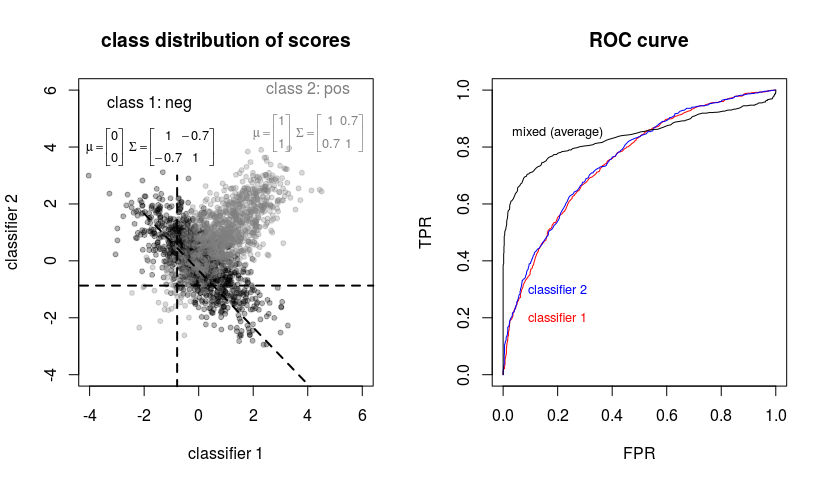
Example of ROC curves that are better in different parts are in this image, from this question Why did meta-learning (or model stacking) underperform the individual base learners?
You can see on the right that the black curve has a larger AUC, but there is a region where it performs less good.
Related question: Determine how good an AUC is (Area under the Curve of ROC)
-
$\begingroup$ What if one model has higher AUC and there is no region where it performs worse than the other model? I.e., one model has an ROC curve at all regions better than the other model. Does it then imply that the first model is always better? Or maybe there are other metrics that, depending on our aim and regardless of ROC, can point which model is better? $\endgroup$– GlueCommented Sep 7, 2022 at 15:56
-
1$\begingroup$ @Glue when the ROC curve of one binary classifier is entirely above the ROC curve of another, then it performs better for any circumstance. The only issue that is left that is the point made in the answer by Bernhard, which is that you might deal with empirical ROC curves and the true curves could be different. $\endgroup$ Commented Sep 7, 2022 at 16:11
-
2$\begingroup$ @Glue as pointed out by Sycorax, there are things that aren't measured by ROC curves, like calibration, but also runtime, memory requirements, storage... $\endgroup$– DavidmhCommented Sep 8, 2022 at 12:48
-
1$\begingroup$ Ah, as Davidmh says, there are indeed other types of performance (although that sounds more as costs and requirements of the classifier than performance/output). $\endgroup$ Commented Sep 8, 2022 at 15:43
(observed) AUC can be influenced by statistical fluctuations
The ROC Curve is usually based on a sample of real world data and taking a sample is a random process. So there is some randomness in the AUC and if you compare two ROC curves, one might be better just by chance.
A good approach is to plot the ROC together with an indication of the remaining error, for example with a 95% confidence interval. You can also compute formal tests whether the difference between to AUCs is significant.
(Should you happen to use R, the pROC package can do both.)
-
$\begingroup$ @SextusEmpiricus has given the better answer. As it does not contain the aspect of randomness I will leave this one here anyways. $\endgroup$– BernhardCommented Sep 7, 2022 at 14:07
-
2$\begingroup$ I have edited both our questions with a heading/tittle such that they become more clearly visible as good answers but based on a different principle. $\endgroup$ Commented Sep 7, 2022 at 14:19

