0
$\begingroup$

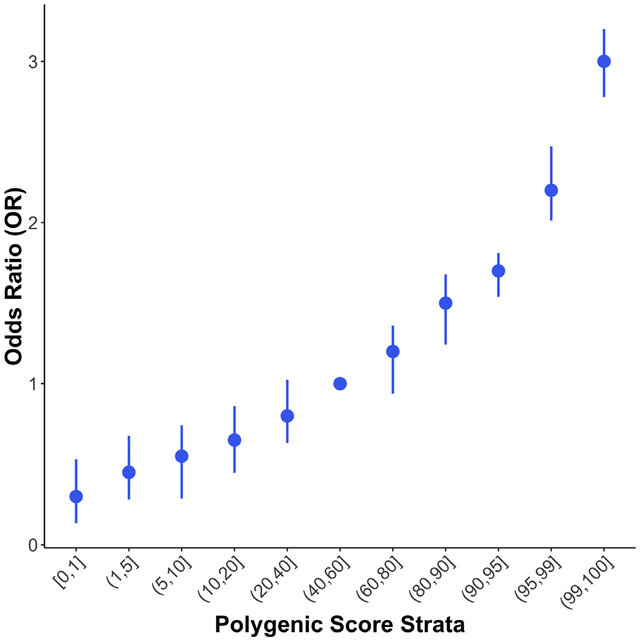
I have a cohort of patients for which I have 2 separate polygenic risk scores. I would like to produce a quantile plot such as this one:

example quantile plot

To do so, I have first divided the PRS score into quantiles, generating the weight_total_PRS_quantile factor with 10 levels, and then produced a logistic model, and finally calculated ORs for each quantile like so:

logistic<-glm(formula = diagnosis ~ weight_total_PRS_quantile, data = scaled_total_PRS, family = binomial, na.action = "na.omit")
total_PRS_ORs<-exp(cbind(coef(logistic), confint(logistic))) 

This works. However, I am now working with combined or partitioned PRSs. So the model I'm fitting is something like:

logistic<-glm(formula = diagnosis ~ PRS_partition1_quantile + PRS_partition2_quantile, data = scaled_total_PRS, family = binomial, na.action = "na.omit")

When I then exponentiate the coefficients I get one OR for each PRS_partition1_quantile, and one OR for each PRS_partition2_quantile. Can I combine these 2 ORs into one? The 2 PRS compartments are independent of each other, it would be a bit like a model calculating the odds for a car accident depending on completely independent predictors, such as how much the driver has drunk and if it's raining. If I had independent ORs, can I combine them into one, such as by adding them up? This would be useful to be able to show the "total OR" for the model for each quantile.

$\endgroup$

2 Answers 2

0
$\begingroup$

"Combining" the ORs is not well defined here. As a post-hoc estimation, eliminating the effect of one to focus on the other is impossible. They are analytically separated. For instance, a $2 \times 2 \times 2$ table has:

$$ \begin{array}{c|cccc} & W=0 & &W = 1 && \\ & X & \bar{X} & X & \bar{X} \\ \hline Y & a & b & r & s \\ \bar{Y} & c & d & u & v \\ \end{array}$$

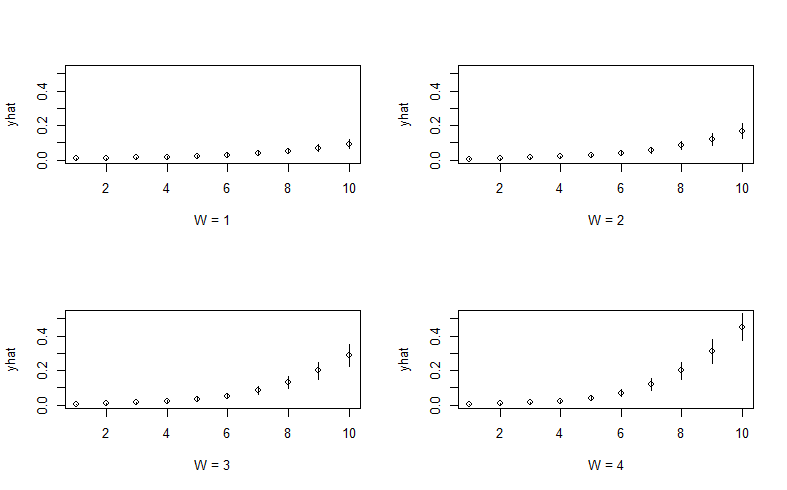
The Mantel Haenszel OR for X is $ OR_{MH} = (ad (abcd) + rv (rsuv))/ (bc(abcd) + su (rsuv))$ whereas the crude OR for X is $OR = (a+r)(d+v)/ ((b + s) (c +_u)$. This is essentially the non-collapsibility of the OR, you can't predict marginal effects without essentially generating predicted values for the entire data structure which is the same as fitting multiple models. But a crude OR may have a range of conditional effects which are generally of more interest when presenting a logistic model to an audience. Consider an approach that I outline below: visualize the conditional effects using a something like a multigrid approach.

x <- 1:10
w <- 1:4
X <- expand.grid(x=x,w=w)
X$yhat <- with(X, plogis(-5 + 0.2*x - 0.3*w + 0.1*x*w))
X$seyhat <- with(X, yhat*(1-yhat) / sqrt(10))
yrange <- c(0, max(X$yhat+X$seyhat))

par(mfrow=c(2,2))

by(X, X$w, function(subX) {
  with(subX, {
    plot(x, yhat, ylim=yrange, xlab=paste('W =', unique(w)))
    segments(x, yhat-seyhat, x, yhat+seyhat)
  })
})

This "coplot" is especially useful to address comments such as "PRS1 and PRS2 are independent" - they may be independent of each other but still multiplicative in the net effect.

enter image description here

$\endgroup$
2
  • $\begingroup$ Dear @AdamO,<br/> many thanks for your reply. I am no statistician and I cannot really understand what is happening here. What is W here? And what are X, Y etc? If I do data.frame(table(df$diagnosis, df$PRS_partition1_quantile, df$PRS_partition2_quantile)) I obtain a table like so:> data.frame(t) Var1 Var2 Var3 Freq 1 healthy 1 1 16604 2 disease 1 1 12 ... 49 healthy 5 5 16519 50 disease 5 5 162 Can I then calculate a combined OR for disease, given belonging to class 1..5 of PRS1 and class 1..5 of PRS2? Many thanks in advance $\endgroup$
    – Emos
    Commented Oct 24, 2022 at 12:44
  • $\begingroup$ @Emos you can't "combine" an OR for two exposures without defining precisely what you mean. Once you do, you should just fit a new univariate model and call it done. You should also get a statistician involved with this project. $\endgroup$
    – AdamO
    Commented Oct 24, 2022 at 15:18
0
$\begingroup$

First of all, it seems to me the fact that you are partitioning in quantiles doesn't matter here, since then you're asking your question about each quantile (correct me if I'm wrong), thus it seems to me it can only add confusion.

Then, you shouldn't make a sum of odds ratios, in case, but a product, since it's a multiplicative measure; in case you wanted a sum, you should transform to log odds.

Moreover, the sum isn't even what you would need, since it would imply that a risk score of 0.5 for everyone wouldn't change things while, in my opinion, it would move everyone's probability to 0.5.

Finally, the product couldn't be done in any case, due to non-collapsibility of the $OR$.

I think the only thing you could do is to reason in terms of probabilities. Suppose the first score $B$ classifies individuals in 2 equally-sized groups, assigning them probability $2/3$ and $1/3$ respectively to have the event (let's say, $A=1$), and the second one $C$ again in 2 equally-sized groups, assigning them probability $3/4$ and $1/4$ respectively to have $A=1$. In line with your example, also suppose $B|A \perp C|A$ and $B|C$, thus independence between $B$ and $C$, both marginally and conditionally on the outcome $A$. In the first case, you get an $OR$ of $\frac{\frac{2/3}{1/3}}{\frac{1/3}{2/3}}=\frac{2}{1/2}=4$; in the second case, you get an $OR$ of $\frac{\frac{3/4}{1/4}}{\frac{1/4}{3/4}}=\frac{3}{1/3}=9$. What happens to a person that is classified with a low probability by both scores vs a one that is classified with a high probability by both scores? We would have (by exploiting the marginal and conditional independence of B and C): $\frac{P(A=1 \cap B=1 \cap C=1)}{P(B=1 \cap C=1)}= \frac{P(B=1 \cap C=1 | A=1)*P(A=1)}{P(B=1)*P(C=1|B=1))}=\frac{1/3*1/4*1/2}{1/2*1/2}=\frac{1/24}{1/4}$, that is individuals with $B=0, A=0$ would have only a probability $1/6$ of having the event, while those with $B=1, A=1$ a probability $5/6$ by symmetry.

You can see it by deciding a sample size: say it is $120$. Then, you have only $20$ among the ones with $B=1$ that have $A=1$, and only $15$ among the ones with $C=1$ that have $A=1$. The first group represent $1/3$ of those with $A=1$, so that, among the $15$ with $(C=1, A=1)$, $5$ would have $B=1$; you can see it also in the other way: the second group represent $1/4$ of those with $A=1$, so that, among the $20$ with $(B=1, A=1)$, $5$ would have $C=1$; also, those with $B=1, C=1$ by independence are $1/2*1/2=1/4=30$, and $5/30=1/6$.

So, the $OR$ in this case would $\frac{5}{1/5}=25$. My guess that a product wouldn't work in any case can be seen by reasoning in terms of risk ratios, since the product would be $2*3=6$, but the real $RR$ would be $5$.

$\endgroup$

Your Answer

By clicking “Post Your Answer”, you agree to our terms of service and acknowledge you have read our privacy policy.

Not the answer you're looking for? Browse other questions tagged or ask your own question.