The amount of data needed to estimate the parameters of a multivariate Normal distribution to within specified accuracy to a given confidence does not vary with the dimension, all other things being the same. Therefore you may apply any rule of thumb for two dimensions to higher dimensional problems without any change at all.
Why should it? There are only three kinds of parameters: means, variances, and covariances. The error of the estimate in a mean depends only on the variance ($\sigma^2$) and the amount of data ($n$). Thus, when $(X_1, X_2, \ldots, X_d)$ has a multivariate Normal distribution and the $X_i$ have variances $\sigma_i^2$, then the estimates of $\mathbb{E[X_i]}$ depend only on the $\sigma_i$ and $n$. Whence, to achieve adequate accuracy in estimating all the $\mathbb{E}[X_i]$, we only need to consider the amount of data needed for the $X_i$ having the largest of the $\sigma_i$. Therefore, when we contemplate a succession of estimation problems for increasing dimensions $d$, all we need to consider is how much the largest $\sigma_i$ will increase. When these parameters are bounded above, we conclude that the amount of data needed does not depend on dimension.
Similar considerations apply to estimating the variances $\sigma_i^2$ and covariances $\sigma_{ij}$: if a certain amount of data suffice for estimating one covariance (or correlation coefficient) to a desired accuracy, then--provided the underlying normal distribution has similar parameter values--the same amount of data will suffice for estimating any covariance or correlation coefficient.
To illustrate, and provide empirical support for this argument, let's study some simulations. The following creates parameters for a multinormal distribution of specified dimensions, draws many independent, identically distributed sets of vectors from that distribution, estimates the parameters from each such sample, and summarizes the results of those parameter estimates in terms of (1) their averages--to demonstrate they are unbiased (and the code is working correctly--and (2) their standard deviations, which quantify the accuracy of the estimates. (Do not confuse these standard deviations, which quantify the amount of variation among estimates obtained over multiple iterations of the simulation, with the standard deviations used to define the underlying multinormal distribution!) My claim is that these standard deviations do not materially change when the dimension $d$ changes, provided that as $d$ changes, we do not introduce larger variances into the underlying multinormal distribution itself.
The sizes of the variances of the underlying distribution are controlled in this simulation by making the largest eigenvalue of the covariance matrix equal to $1$. This keeps the probability density "cloud" within bounds as the dimension increases, no matter what the shape of this cloud might be. Simulations of other models of behavior of the system as the dimension increases can be created simply by changing how the eigenvalues are generated; one example (using a Gamma distribution) is shown commented out in the R code below.
What we are looking for is to verify that the standard deviations of the parameter estimates do not appreciably change when the dimension $d$ is changed. I therefore show the results for two extremes, $d=2$ and $d=60$, using the same amount of data ($30$) in both cases. It is noteworthy that the number of parameters estimated when $d=60$, equal to $1890$, far exceeds the number of vectors ($30$) and exceeds even the individual numbers ($30*60=1800$) in the entire dataset.
Let's begin with two dimensions, $d=2$. There are five parameters: two variances (with standard deviations of $0.097$ and $0.182$ in this simulation), a covariance (SD = $0.126$), and two means (SD = $0.11$ and $0.15$). With different simulations (obtainable by changing the starting value of the random seed) these will vary a bit, but they will consistently be of comparable size when the sample size is $n=30$. For instance, in the next simulation the SDs are $0.014$, $0.263$, $0.043$, $0.04$, and $0.18$, respectively: they all changed but are of comparable orders of magnitude.
(These statements can be supported theoretically but the point here is to provide a purely empirical demonstration.)
Now we move to $d=60$, keeping the sample size at $n=30$. Specifically, this means each sample consists of $30$ vectors, each having $60$ components. Rather than list all $1890$ standard deviations, let's just look at pictures of them using histograms to depict their ranges.

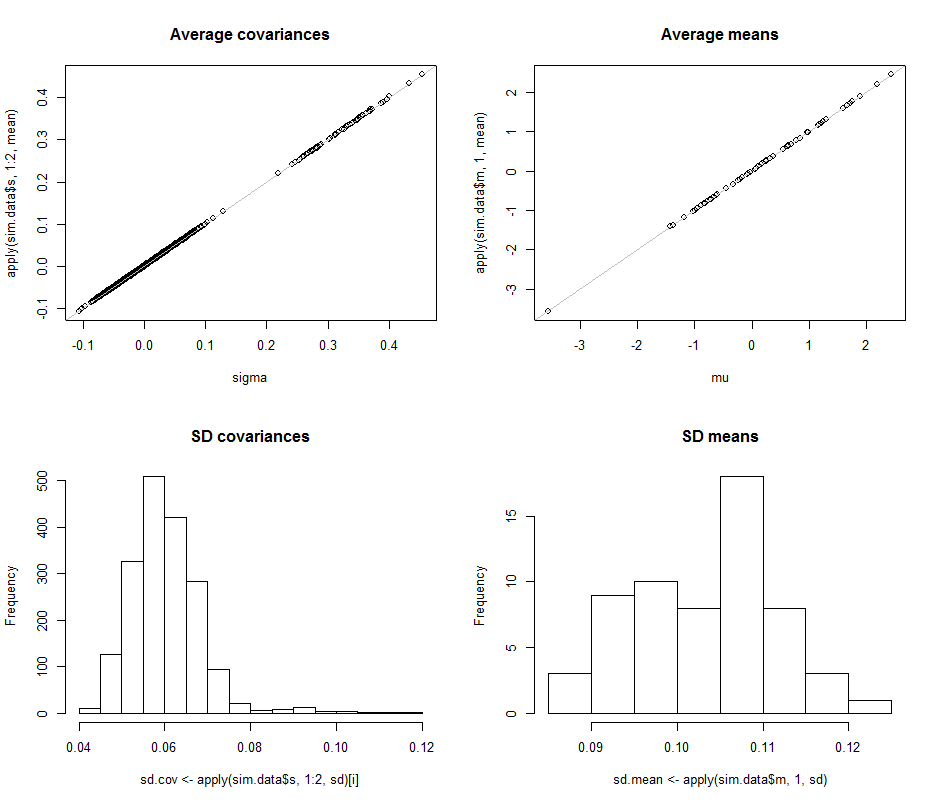
The scatterplots in the top row compare the actual parameters sigma ($\sigma$) and mu ($\mu$) to the average estimates made during the $10^4$ iterations in this simulation. The gray reference lines mark the locus of perfect equality: clearly the estimates are working as intended and are unbiased.
The histograms appear in the bottom row, separately for all entries in the covariance matrix (left) and for the means (right). The SDs of the individual variances tend to lie between $0.08$ and $0.12$ while the SDs of the covariances between separate components tend to lie between $0.04$ and $0.08$: exactly in the range achieved when $d=2$. Similarly, the SDs of the mean estimates tend to lie between $0.08$ and $0.13$, which is comparable to what was seen when $d=2$. Certainly there's no indication that the SDs have increased as $d$ went up from $2$ to $60$.
The code follows.
#
# Create iid multivariate data and do it `n.iter` times.
#
sim <- function(n.data, mu, sigma, n.iter=1) {
  #
  # Returns arrays of parmeter estimates (distinguished by the last index).
  #
  library(MASS) #mvrnorm()
  x <- mvrnorm(n.iter * n.data, mu, sigma)
  s <- array(sapply(1:n.iter, function(i) cov(x[(n.data*(i-1)+1):(n.data*i),])),
        dim=c(n.dim, n.dim, n.iter))
  m <-array(sapply(1:n.iter, function(i) colMeans(x[(n.data*(i-1)+1):(n.data*i),])),
            dim=c(n.dim, n.iter))
  return(list(m=m, s=s))
}
#
# Control the study.
#
set.seed(17)
n.dim <- 60
n.data <- 30    # Amount of data per iteration
n.iter <- 10^4  # Number of iterations
#n.parms <- choose(n.dim+2, 2) - 1
#
# Create a random mean vector.
#
mu <- rnorm(n.dim)
#
# Create a random covariance matrix.
#
#eigenvalues <- rgamma(n.dim, 1)
eigenvalues <- exp(-seq(from=0, to=3, length.out=n.dim)) # For comparability
u <- svd(matrix(rnorm(n.dim^2), n.dim))$u
sigma <- u %*% diag(eigenvalues) %*% t(u)
#
# Perform the simulation.
# (Timing is about 5 seconds for n.dim=60, n.data=30, and n.iter=10000.)
#
system.time(sim.data <- sim(n.data, mu, sigma, n.iter))
#
# Optional: plot the simulation results.
#
if (n.dim <= 6) {
  par(mfcol=c(n.dim, n.dim+1))
  tmp <- apply(sim.data$s, 1:2, hist)
  tmp <- apply(sim.data$m, 1, hist)
}
#
# Compare the mean simulation results to the parameters.
#
par(mfrow=c(2,2))
plot(sigma, apply(sim.data$s, 1:2, mean), main="Average covariances")
abline(c(0,1), col="Gray")
plot(mu, apply(sim.data$m, 1, mean), main="Average means")
abline(c(0,1), col="Gray")
#
# Quantify the variability.
#
i <- lower.tri(matrix(1, n.dim, n.dim), diag=TRUE)
hist(sd.cov <- apply(sim.data$s, 1:2, sd)[i], main="SD covariances")
hist(sd.mean <- apply(sim.data$m, 1, sd), main="SD means")
#
# Display the simulation standard deviations for inspection.
#
sd.cov
sd.mean


