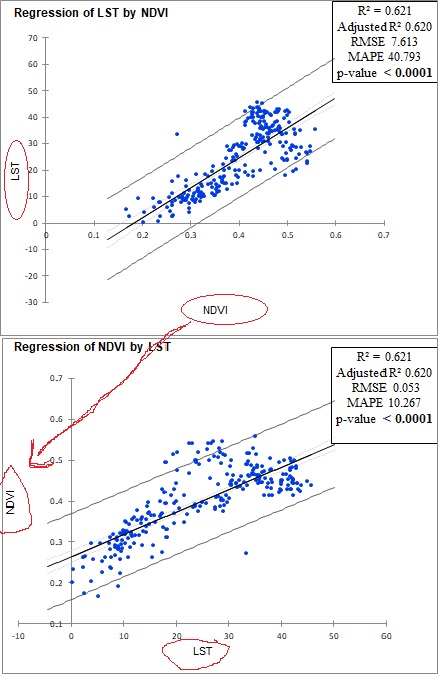
I need your help regarding the information inside the picture. As you know all the information will change with the change of NDVI axis from y-axis to X-axis, except R2 and p-value remain the same? Why RMSE and MAPE changes with the change of axis?
Thank you all
1 Answer
Conventional linear regression (i.e. model I) assumes that x variable has no error and minimizes only the vertical errors (this is the reason that the lines change when you sweep the axes) (Ludbrook 2012). Since the Root Mean Square Error (RMSE) is the standard deviation of the (vertical) residuals (prediction errors) it will change when you sweep the axes; in fact, RMSE have units (the same as the Y variable) and so the two RMSEs also have different units (if the variables have units) and cannot be compared. What is the purpose of the regression line? Prediction or description? Use the one that you would think is the predictor as x and the one you would like to predict as Y (or use model II regression, if appropriate).
Mean Absolute Percentage Errors (MAPE) are percentages without units but since they scale with the Y observed values, it is not surprising that they also vary (perhaps less than RMSE) when you sweep the axes (like most regression statistics).
